Bulls extend fall gains
- Stocks extend rally during holiday-shortened week
- Oil volatility continues, durable goods orders drop
- This week: GDP, Fed inflation, home prices and sales
It may have seemed like a relatively quiet holiday week, but the US market made it noteworthy, notching four straight up weeks for the first time since June.
The S&P 500 (SPX) closed Wednesday (and Friday) at its highest level since July 31 as one of the week’s key reports, Durable Goods Orders, added to the recent string of datapoints highlighting a slowing US economy. It’s a development that some investors have embraced, believing, right or wrong, it will hasten the arrival of market-friendly rate cuts:
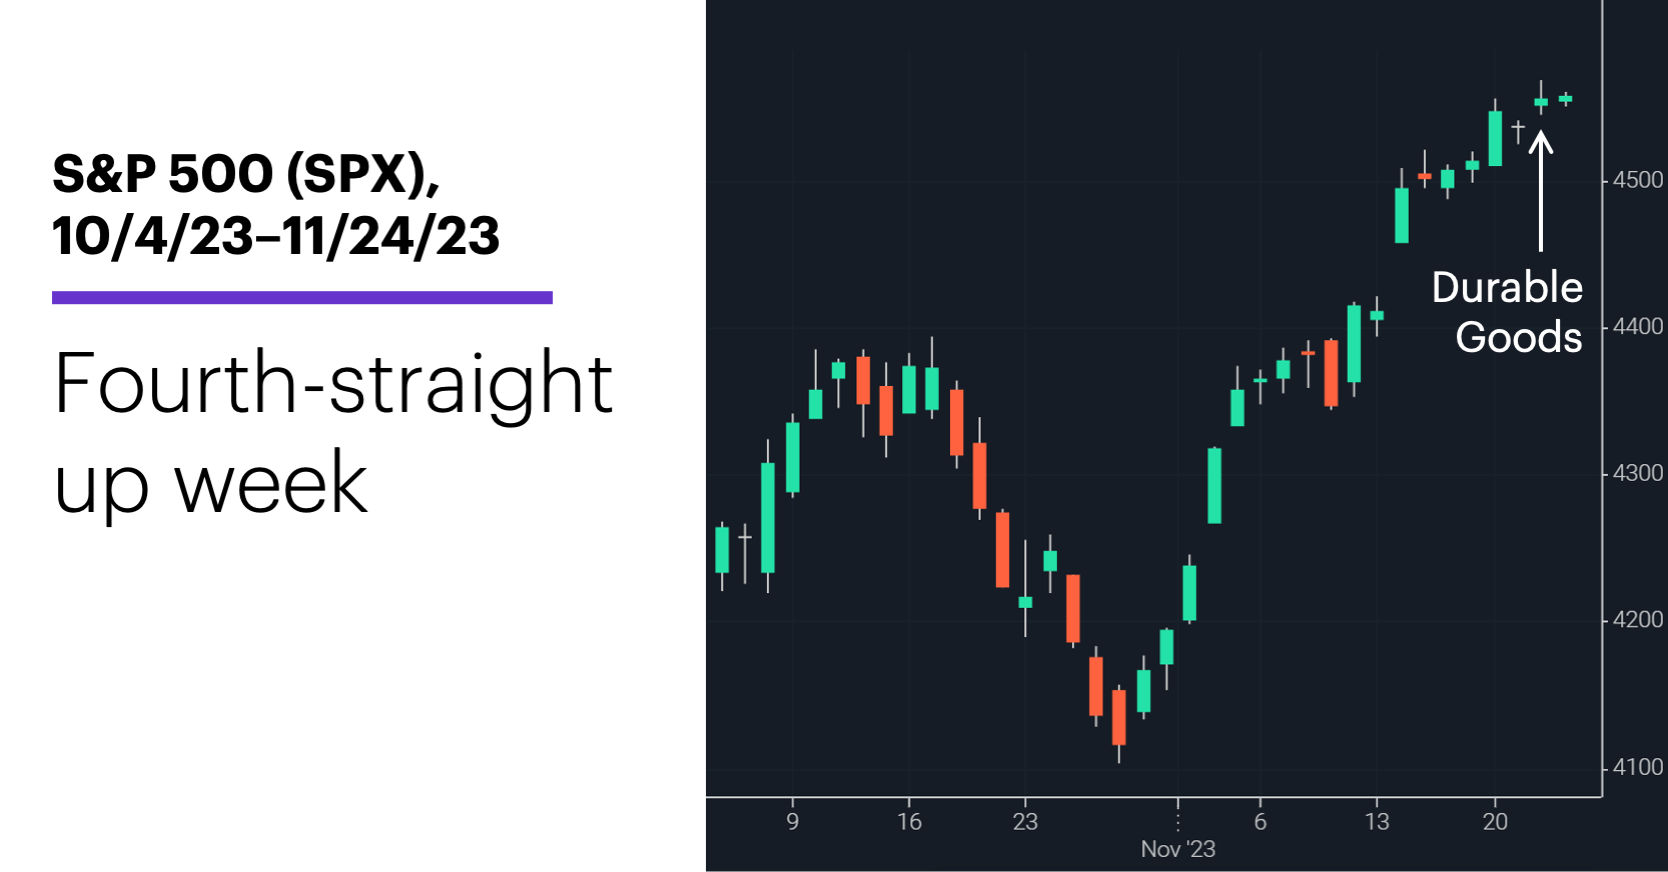
Source: Power E*TRADE. (For illustrative purposes. Not a recommendation. Note: It is not possible to invest in an index.)
The headline: Bulls make the most of shortened week.
The fine print: The SPX made good on two “micro-seasonal” Thanksgiving-week patterns, closing higher the day before the holiday for the 56th time in the past 74 years, and closing higher the day after it for the 52nd time. (Today we’ll find out if the historical tendency to close lower the Monday after Thanksgiving plays out.)
The number: -0.1%, the surprise contraction in October core durable goods orders reported last Wednesday—the latest datapoint highlighting a cooling US economy. Also, September’s reading was revised lower from +0.6% to -0.2%.
The scorecard: All the major indexes were positive last week, with large caps leading the charge:
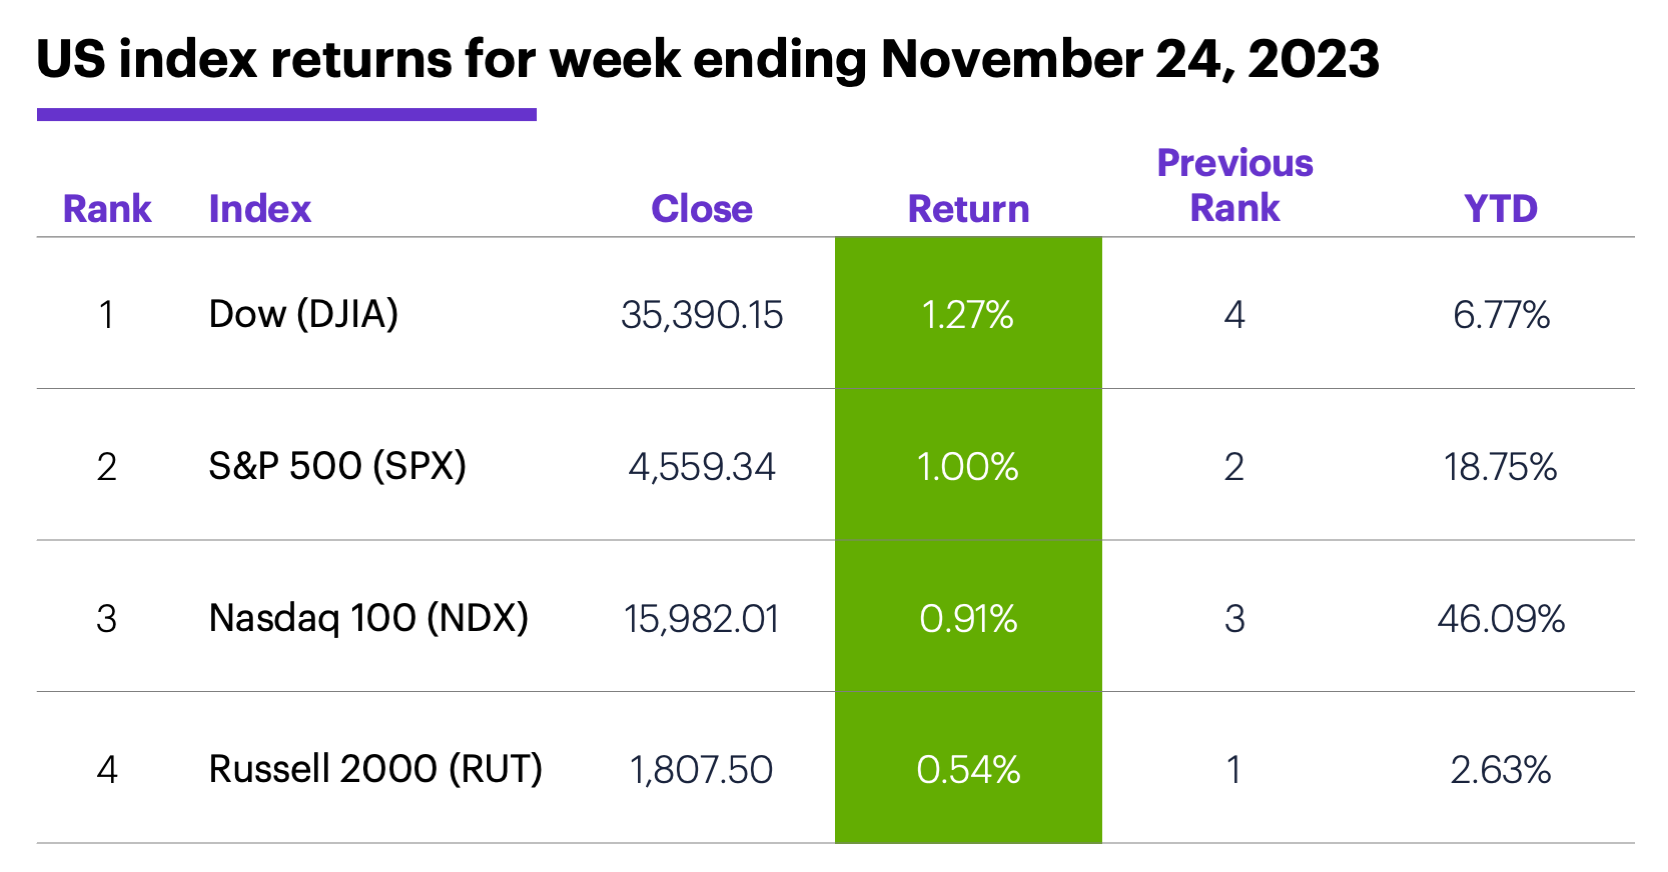
Source (data): Power E*TRADE. (For illustrative purposes. Not a recommendation.)
Sector returns: The strongest S&P 500 sectors last week were health care (+2.2%), consumer staples (+1.4%), and communication services (+1.3%). The weakest sectors were energy (+0.2%), utilities (+0.55%), and tech (+0.61%).
Stock movers: HireRight (HRT) +32% to $13.25 on Monday, Symbotic (SYM) +40% to $52.08 on Tuesday. On the downside, Avita Medical (RCEL) -19% to $10.17 and American Eagle Outfitters (AEO) -16% to $16.63 on Tuesday.
Futures: After starting last week with a solid rally, January WTI crude oil (CLF4) pulled back to end the week lower at $75.54. December gold (GCZ3) climbed back above the $2,000 threshold, closing Friday at a three-week high of $2,003.
Coming this week
Traders will get a look at the first revision to Q3 GDP, along with the Fed’s preferred inflation gauge (the PCE Price Index), and more housing numbers:
●Monday: New Home Sales
●Tuesday: S&P Case-Shiller Home Price Index, FHFA House Price Index, Consumer Confidence
●Wednesday: GDP (Q3, second estimate), Retail and Wholesale Inventories (advance), Fed Beige Book
●Thursday: Personal Income and Spending, PCE Price Index, Chicago PMI, Pending Home Sales
●Friday: S&P Global Manufacturing PMI, ISM Manufacturing Index, Construction Spending
A final burst of tech highlights this week’s earnings. A few highlights:
•Monday: Zscaler (ZS), Anavex Life Sciences (AVXL)
•Tuesday: CrowdStrike (CRWD), Hewlett Packard Enterprise (HPE), Intuit (INTU), NetApp (NTAP), Splunk (SPLK), Workday (WDAY)
•Wednesday: Dollar Tree (DLTR), Foot Locker (FL), Okta (OKTA), PVH (PVH), Snowflake (SNOW)
●Thursday: Cracker Barrel (CBRL), Kroger (KR), Ambarella (AMBA), Salesforce (CRM), Dell Technologies (DELL), Marvell Technology (MRVL), Ulta Beauty (ULTA), VMware (VMW)
•Friday: Bank of Montreal (BMO)
Check the Active Trader Commentary each morning for an updated list of earnings announcements, IPOs, economic reports, and other market events.
December stock market performance
As this week ends, a new month will begin—one whose returns have experienced a subtle shift in recent years.
Overall, from 1982–2022 December was one of the best months of the year for the US stock market. The SPX’s median December return was 1.5% (third largest) and it posted a net gain for the month in 31 out of 41 years (76% of the time, the highest percentage of any month):
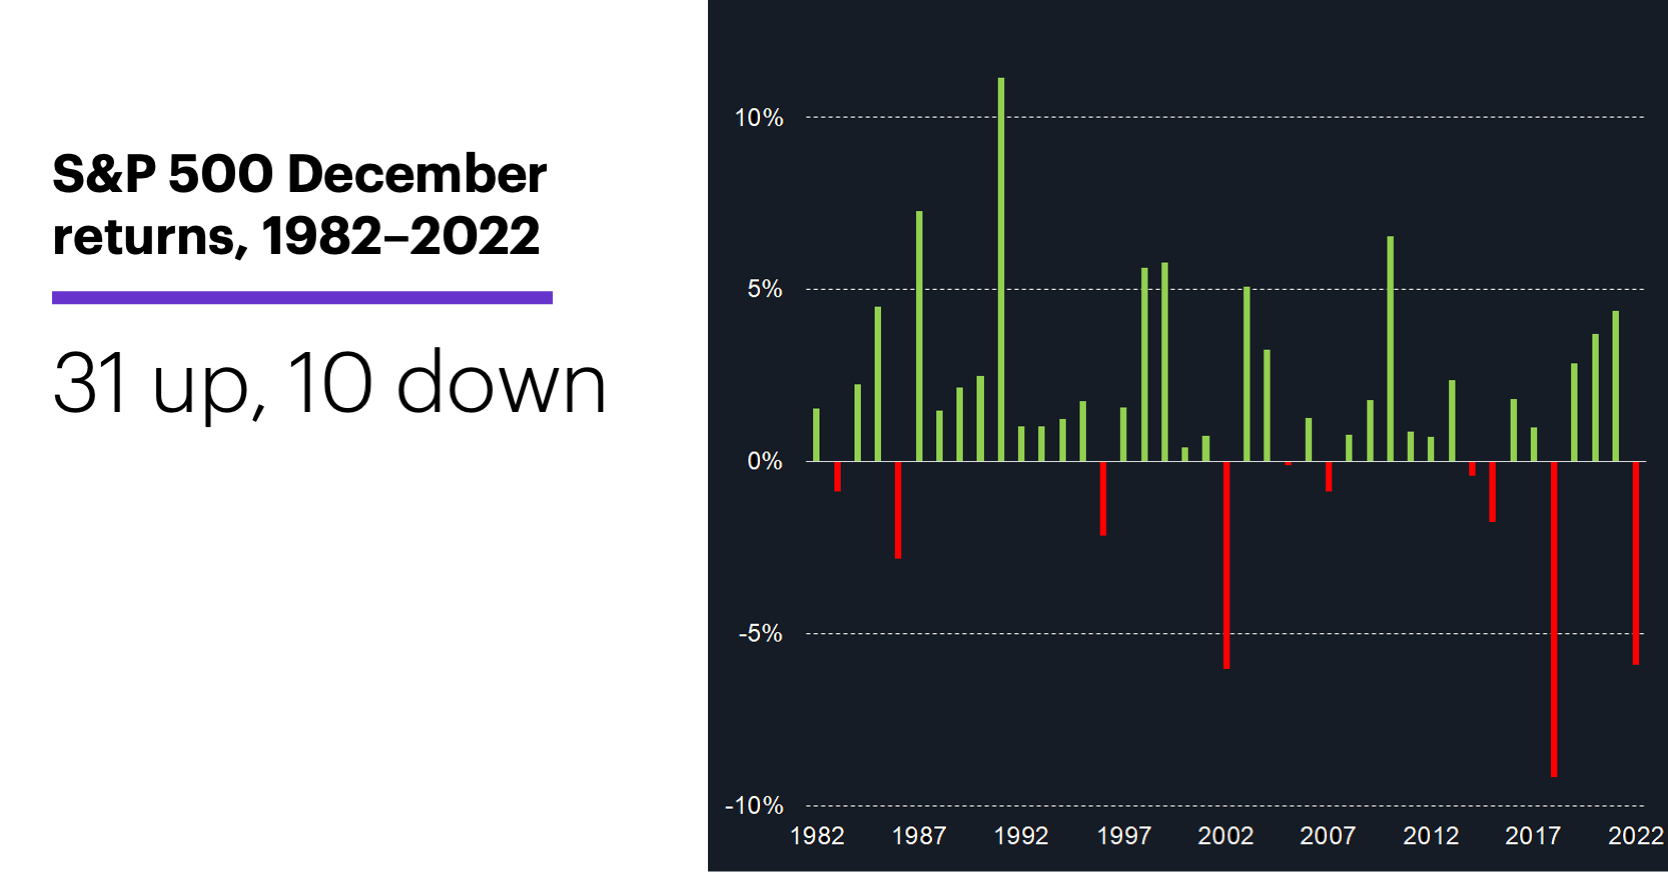
Data source: Power E*TRADE. (For illustrative purposes, not a recommendation. Note: It is not possible to invest in an index.)
But a good deal of that bullishness occurred more than 20 years ago. From 1982–2001, December was a positive month 85% of the time, with an average SPX return of 2.3%. Over the most recent 20 years, December was a positive month 70% of the time and had a 1.1% median return (seventh highest)—in other words, still bullish, just not to the same degree.
And while large December losses have been rare over the past 41 years, two of the biggest were recent—2018’s 9.2% sell-off and last year’s 5.9% decline.1 Also, December hasn’t always gotten off to a fast start. Over the past 66 years, the SPX closed down more often than up on the first two trading days of the month (55% and 52% of the time, respectively).
Finally, for a look at how the holiday shopping season could fit into this picture, check out Morgan Stanley & Co.’s U.S. Consumer: Mixed Holiday Spending Expectations.
Click here to log on to your account or learn more about E*TRADE's trading platforms, or follow the Company on Twitter, @ETRADE, for useful trading and investing insights.
1 All figures reflect S&P 500 (SPX) monthly and daily closing prices (1/2/82–12/31/22 and 1/3/57–12/31/82, respectively). Supporting document available upon request.