Another inflation dip for stocks
- Stocks pull back as inflation hits 30-year high, gold jumps
- Choppy week for oil, materials sector gets infrastructure boost
- This week: Retail sales (and earnings), housing data, leading indicators
If the past few months have shown anything, it’s that one way to occasionally cool off a hot stock market may be to “douse” it with hot inflation data.
After closing at a record high last Monday, the S&P 500 (SPX) pulled back, with the dip reaching its low point after last Wednesday’s Consumer Price Index (CPI) report showed inflation rose in October at its fastest clip in three decades.1 But a solid Friday rally recouped a good portion of the setback:
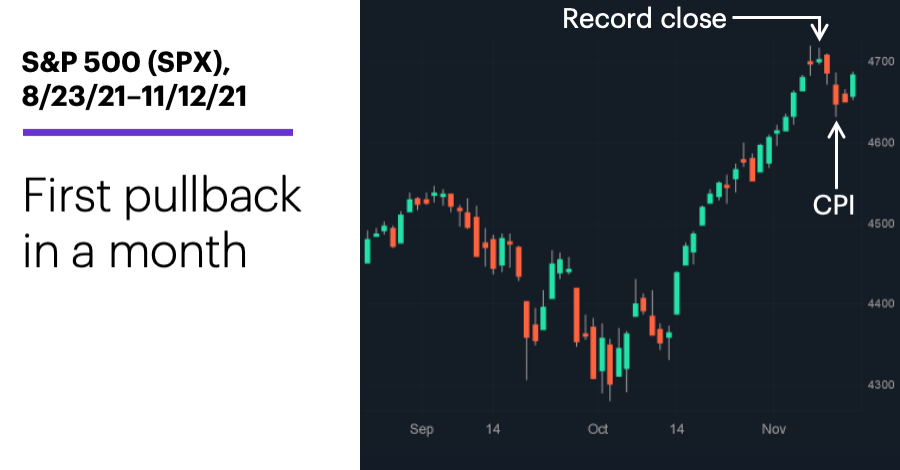
Source: Power E*TRADE. (For illustrative purposes. Not a recommendation.)
The headline: Stocks wobble as consumer prices continue to rise.
The fine print: It’s worth noting that last week’s pullback followed a stretch of 19 trading days, during which the SPX gained 8.1%—nearly 13 times its average 19-day return2—and closed lower only two times.
The move: After a sharp downturn a week earlier, longer-term interest rates jumped again after Wednesday’s CPI release: The 10-year T-note yield spiked from 1.43% to 1.56%—its biggest one-day increase since February.
The scorecard: Losses were modest, but the small-cap Russell 2000 (RUT) and the Nasdaq 100 (NDX) tech index took the biggest steps back last week:
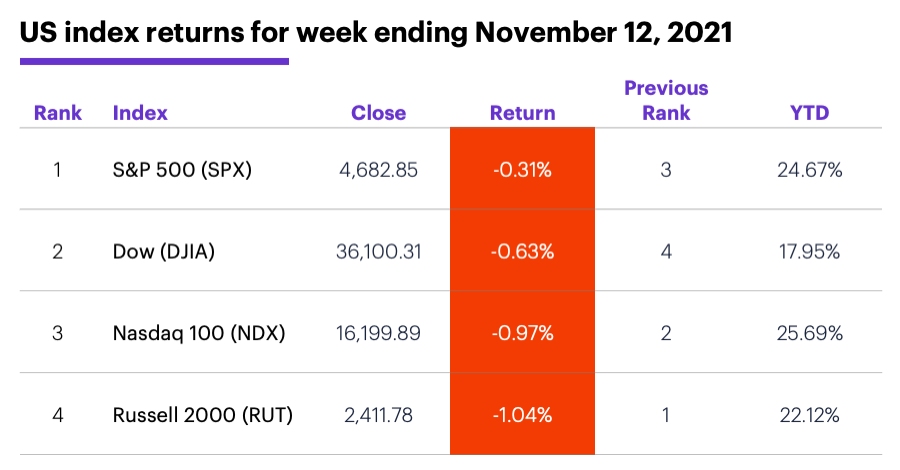
Source (data): Power E*TRADE. (For illustrative purposes. Not a recommendation.)
Sector roundup: The strongest S&P 500 sectors last week were materials (+2.5%), health care (+0.7%), and industrials (+0.4%). The weakest sectors were consumer discretionary (-3.2%), energy (-1.8%), and utilities (-1%).
Highlight reel: On Monday Newegg (NEGG) +59% to $18.82, Roblox (RBLX) +42% to $109.52 on Tuesday. On the downside, Amyris (AMRS) -39% to $7.96 and Arrival Group (ARVL) -28% to $12.88 on Tuesday.
Futures action: December gold (GCZ1) wrapped up its best week since May, closing Friday near a five-month high at $1,868.50. Meanwhile, December silver (SIZ1), which has gained twice as much as gold since late September, broke out above its multi-month resistance level (see “Knocking on the price ceiling”). After closing at a contract high of $84.57/barrel last Tuesday, December WTI crude oil (CLZ1) tumbled as low as $79.78 on Friday before ending the week at $80.79. Biggest up moves: January orange juice (OJF2) +9.7%, December soybean meal (ZMZ1) +8.8%. Biggest down moves: December natural gas (NGZ1) -13%, January lumber (LBSF2) -6.3%.
Coming this week
This week’s numbers include:
●Today: Empire State Manufacturing Index
●Tuesday: Retail Sales, Import and export prices, Industrial Production and Capacity Utilization, Business Inventories, NAHB Housing Market Index
●Wednesday: Housing Starts and Building Permits
●Thursday: Leading Indicators Index
This week kicks off the retail portion of earnings season, which also includes some high-profile tech names:
●Today: Warner Music (WMG), Lucid (LCID), Tyson Foods (TSN), Advance Auto Parts (AAP)
●Tuesday: Home Depot (HD), Walmart (WMT), Jumia Technologies (JMIA)
●Wednesday: Lowe's (LOW), Target (TGT), NVIDIA (NVDA), TJX (TJX), Cisco (CSCO), Bath & Body Works (BBWI), Victoria's Secret (VSCO), Sociedad Quimica y Minera De Chile S.A. (SQM)
●Thursday: Canadian Solar (CSIQ), Applied Materials (AMAT), Kohl's (KSS), Alibaba (BABA), JD.com (JD), Macy's Inc. (M), Ross Stores (ROST), Palo Alto Networks (PANW), Workday (WDAY), Intuit (INTU)
●Friday: Buckle (BKE), Foot Locker (FL)
This week’s IPOs include: Braze (BRZE), UserTesting (USER), KinderCare Learning Center (KLC), Sweetgreen (SG).
Check the Active Trader Commentary each morning for an updated list of earnings announcements, IPOs, economic reports, and other market events.
‘Tis the (retail) season
Get ready to hear a lot about retail—retail earnings (this week and next), retail sales (monthly report released tomorrow), and the outlook for the holiday shopping season.
Here’s a slightly different take on the subject. The following chart compares the median returns of the S&P 500 and the S&P retail sector for the month (21 trading days) before and after Thanksgiving over the past 15 years:
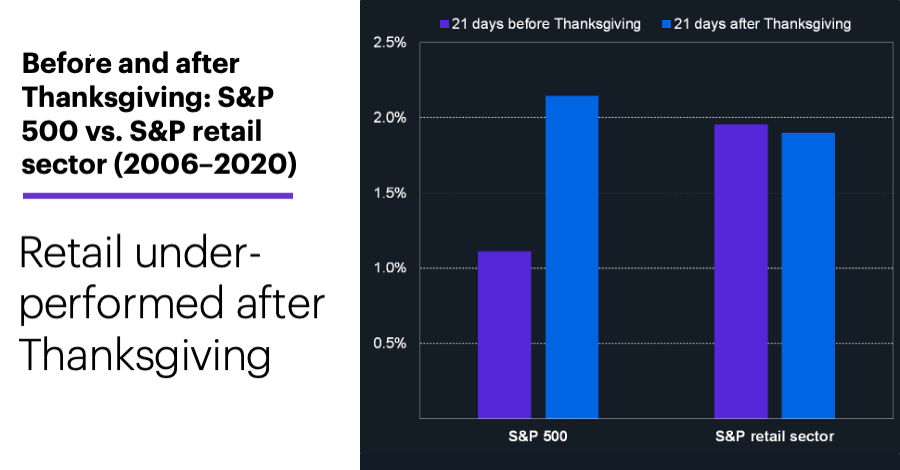
Source (data): Power E*TRADE. (For illustrative purposes. Not a recommendation.)
Two takeaways: The S&P 500’s typical post-Thanksgiving return was much stronger than its pre-Thanksgiving return, while the retail sector was slightly weaker after the holiday than before it.3 Also the retail sector’s post-Thanksgiving return (1.9%) was smaller than the S&P 500’s (2.2%)—in other words, the sector tended to underperform the broad market during the holidays.
Click here to log on to your account or learn more about E*TRADE's trading platforms, or follow the Company on Twitter, @ETRADE, for useful trading and investing insights.
1 Bloomberg. Inflation in U.S. Builds With Biggest Gain in Prices Since 1990. 11/10/21.
2 Reflects the average 19-day S&P 500 (SPX) return of 0.62% from 12/23/59–9/17/20. Supporting document available upon request.
3 Figures reflect S&P 500 and S&P 500 Retail Index daily price data, 11/1/06–12/31/20. Supporting document available upon request.