Nasdaq highs and lows
- NDX up more than 40% this year
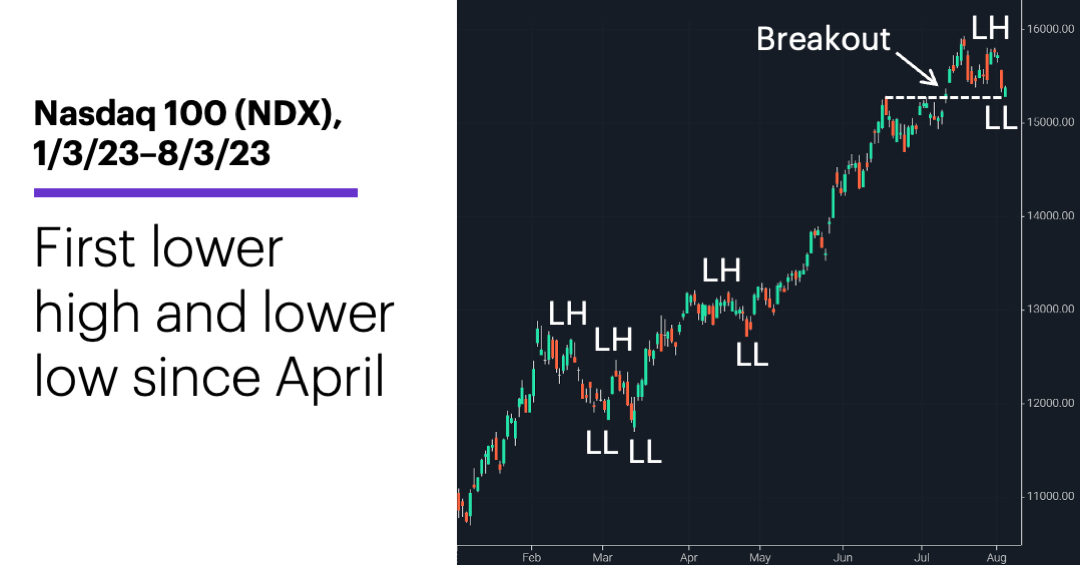
- Index fell to a lower high and lower low this week
- Retreat also tested recent breakout level
Through Thursday, this week’s downturn in US stocks was nothing out of the ordinary. The S&P 500’s loss wasn’t much bigger than its early-July pullback, and it was significantly smaller than its June downturn.
While the Nasdaq 100’s (NDX) current pullback has also been relatively modest so far, the tech index has distinguished itself in a different way. After its most recent bounce failed to reach the level of its July 18–19 highs, the NDX fell below its July 24 swing low on Wednesday—thus establishing a set of lower highs (LH) and lower lows (LL) for just the fourth time this year. Yesterday’s low also constituted a test of the index’s breakout above its June and early July highs:
Source: Power E*TRADE. (For illustrative purposes. Not a recommendation. Note: It is not possible to invest in an index.))
Just as a series of higher highs and higher lows (the prevailing pattern for most of this year) is a basic definition of an uptrend, repeated lower highs and lower lows (the prevailing pattern for most of last year) represents a downtrend—or, perhaps, pause within an uptrend.
Despite what anyone says, there’s no way to know if the current pullback will turn out to be a temporary interruption of the NDX’s uptrend, or the beginning of a more significant reversal. As the chart illustrates, it takes more than one or two sets of lower highs and lower lows to constitute a downtrend. The NDX fell 8.7% from its February 2 close to its March 13 low (the second “LL” of that series), but has since rallied more than 35%.
Market Mover Update: A day after falling 2% and closing at $79.75, September WTI crude oil futures (CLU3) rallied 2.8% on Thursday—trading as high as $81.86—after Saudi Arabia announced it would extend its one million barrel/day output reduction into September (see “Oil rally nears test”). After releasing earnings in the pre-market, Cognex (CGNX) fell 4.9% in early trading on Thursday, but rebounded to close near breakeven (see “Pre-earnings fireworks”).
Today’s numbers include (all times ET): Employment Report (8:30 a.m.).
Today’s earnings include: Dominion Energy (D), Fluor (FLR), XPO (XPO), Cboe Global Markets (CBOE), PPL (PPL).
Click here to log on to your account or learn more about E*TRADE's trading platforms, or follow the Company on Twitter, @ETRADE, for useful trading and investing insights.