Bulls take week, month (and quarter)
- Stocks extend rebound, small caps lead
- Fed inflation slows, best Nasdaq quarter since 2020
- This week: Jobs report, construction, factory orders
A little less than three weeks since the S&P 500 (SPX) briefly dipped into negative territory for the year, the broad market will kick off April up 7% after notching a positive March and its best week since November.
The SPX was flat for the month last Monday, but a strong Friday rally helped it end the week at its highest level since February 15:
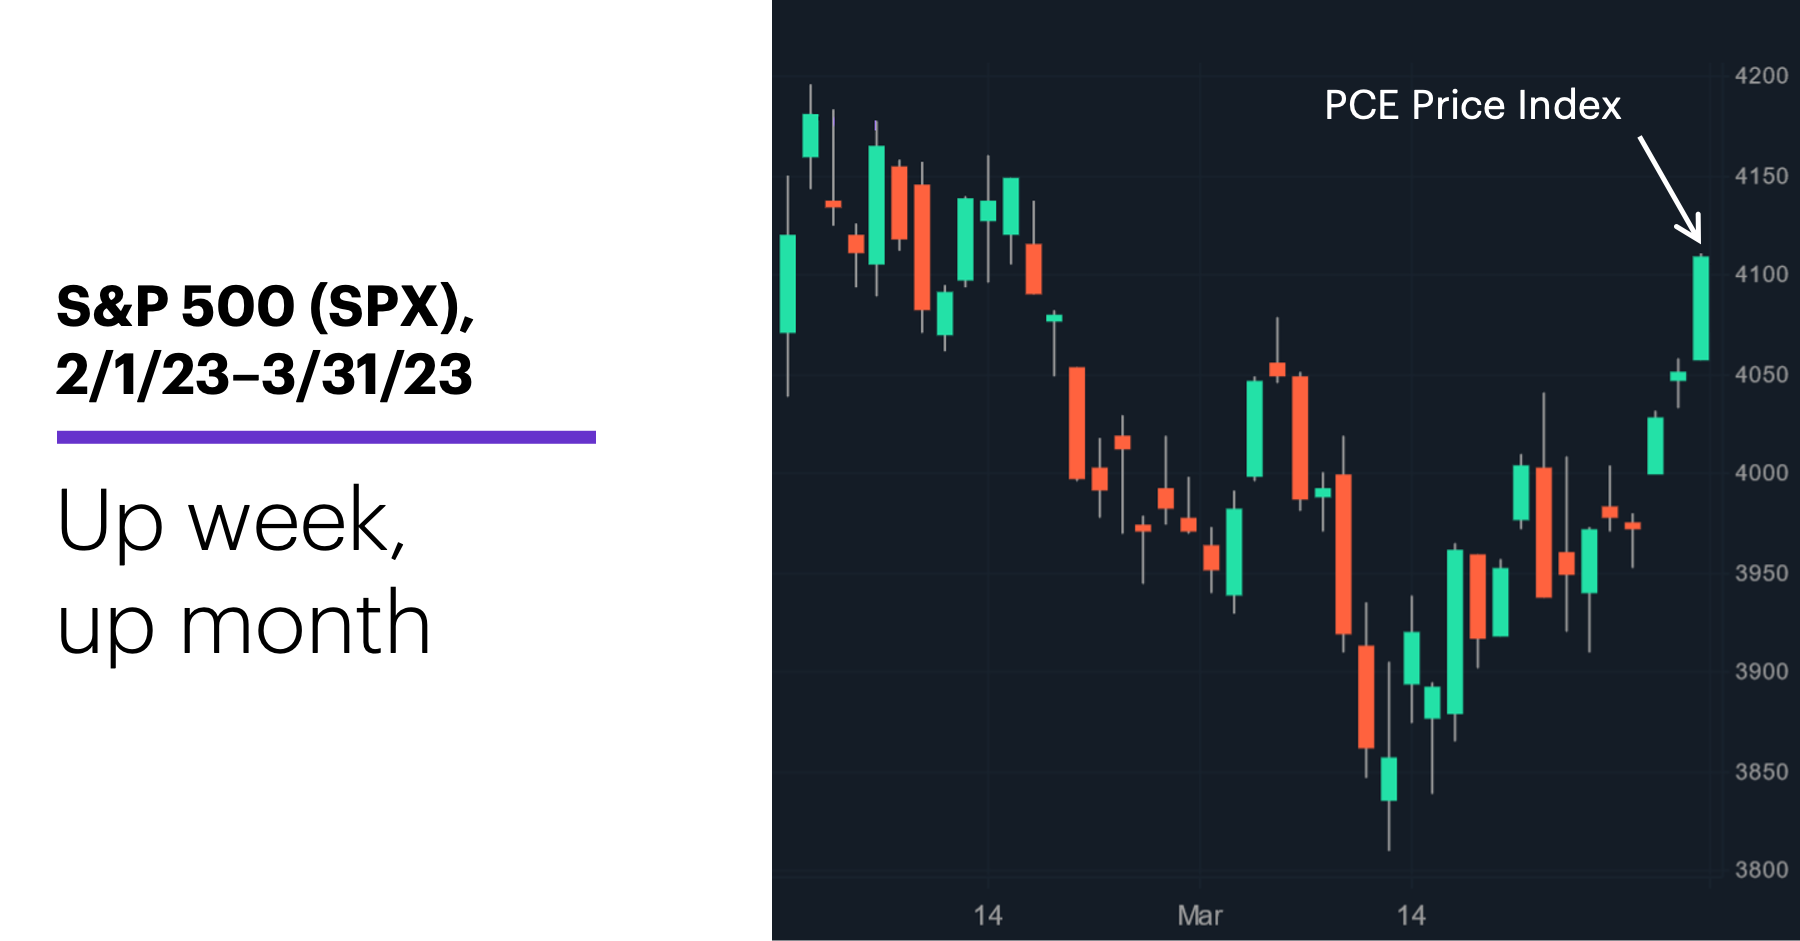
Source: Power E*TRADE. (For illustrative purposes. Not a recommendation.) Note: It is not possible to directly invest in an index.
The headline: Stocks end Q1 on bullish note.
The fine print: While the broad market continued to appear to move past the recent banking sector volatility—the SPX ended last week more than 6% above its March 13 close—the S&P 500 regional bank index continued to show its impact: It gained only 0.8% last week, and closed Friday 1.3% lower than on March 13. (Morgan Stanley & Co. analysts recently shared their thoughts about some of the longer-term implications of the bank turmoil.1)
The number: Given the Fed always says the Personal Consumption Expenditures (PCE) Price Index—not the Consumer Price Index—is its preferred inflation gauge, the indicator often seems to slip under the radar. On Friday, though, traders may have been paying attention: The PCE showed core inflation rose 0.3% in February—less than expected and below January’s 0.5% reading.
The scorecard: The small cap Russell 2000 (RUT) led the market last week, and got back into positive territory for the year in the process. Meanwhile, the Nasdaq 100 (NDX) wrapped up its best quarter since June 2020:
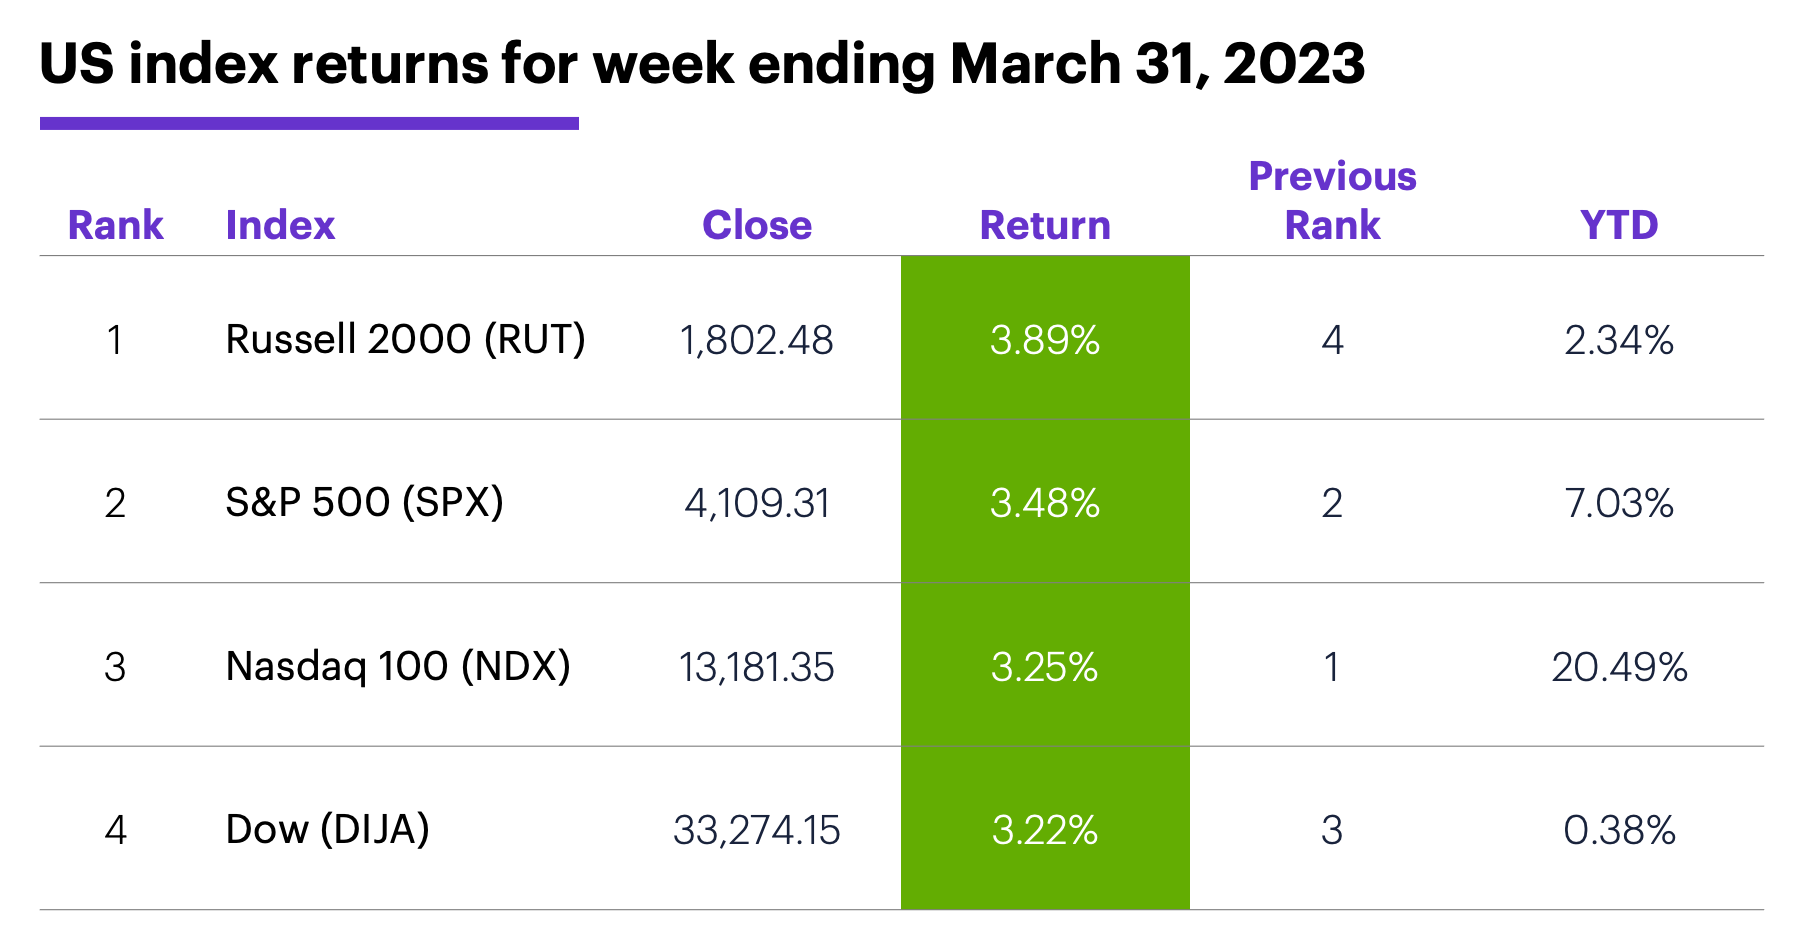
Source (data): Power E*TRADE. (For illustrative purposes. Not a recommendation.)
Sector returns: The strongest S&P 500 sectors last week were energy (+6%), consumer discretionary (+5.2%), and materials (+4.5%). The weakest sectors were communication services (+1.1%), health care (+1.5%), and consumer staples (+2.3%).
Stock movers: First Citizens Bancshares (FCNCA) +54% to $895.61 on Monday, Biomea Fusion (BMEA) +99% to $30.71 on Tuesday. Metropolitan Bank (MCB) -28% to $25.36 and Semtech (SMTC) -21% to $25.25, both on Thursday.
Futures: May WTI crude oil (CLK3) closed Friday at its highest level since March 10, up more than $6/barrel at $75.67. April gold (GCJ3) alternated between up and down days to end last week modestly lower at $1,969/ounce. Week’s biggest up moves: May WTI crude oil (CLK3) +9.3%, May cotton (CTK3) +8.2%. Week’s biggest down moves: April VIX (VXJ3) -10.6%, May natural gas (NGK3) -6.1%.
Coming this week
US stock exchanges will be closed for Good Friday, but the monthly jobs report will still be released that day:
●Monday: S&P Global Manufacturing PMI, ISM Manufacturing Index, Construction Spending
●Tuesday: Job Openings and Labor Turnover Survey (JOLTS), Factory Orders
●Wednesday: ADP Employment Change, Trade Balance, S&P Global Services PMI, ISM Services Index
●Thursday: Challenger Job Cuts, Vehicle Sales
●Friday: Employment Report (markets closed for Good Friday)
This week’s earnings include:
●Monday: Science Applications (SAIC)
●Tuesday: Acuity Brands (AYI), Lindsay (LNN), MSC Industrial (MSM), Resources Connection (RGP), Smart Global (SGH), Kura Sushi (KRUS)
●Wednesday: Conagra (CAG), Schnitzer Steel (SCHN), Simply Good Foods (SMPL)
●Thursday: Lamb Weston (LW), RPM International (RPM), Constellation Brands (STZ), Levi Strauss (LEVI), WD 40 (WDFC)
Check the Active Trader Commentary each morning for an updated list of earnings announcements, IPOs, economic reports, and other market events.
Q1 comp
When the SPX ended March 2022 down 5% for the year, it was only the 12th negative Q1 since 1985. This year has been something of a return to historical norms, as the SPX closed Friday up 7% for the year—more than the 2.9% return for all Q1s since 1985, but more or less in line with the average positive Q1 return of 6.6%.2
Prior to this year, the SPX had a positive Q1 in 26 of the past 38 years. After those 26 positive first quarters, the index gained additional ground through the end of the year 22 times (i.e., it was higher on the last trading day of December than it had been on the last trading day of March).
The four exceptions, and some of the conspicuous market-moving developments of those years: 1987 (October “Black Monday” crash), 2000 (dot-com implosion), 2011 (US debt-ceiling crisis and debt downgrade), and 2015 (China stock market sell-off, European sovereign-debt crisis).
Click here to log on to your account or learn more about E*TRADE's trading platforms, or follow the Company on Twitter, @ETRADE, for useful trading and investing insights.
1 MorganStanley.com. Is Banking Stress the Last Straw for the Bear Market. 2/24/23.
2 All figures reflect S&P 500 (SPX) monthly closing prices, 1985–2023. Supporting document available upon request.