Market climbs again
- Fed hikes, GDP surprises to upside, stocks gain
- GOOGL and META beat earnings, oil tops $80
- This week: Jobs, 1,300-plus earnings (incl. AMZN and AAPL)
A third-straight up week for US stocks appeared be in jeopardy last Thursday when the S&P 500 (SPX) reversed to close lower after hitting its highest price since March. But after a Friday rebound, bulls came out on top of a news-packed week that included a rate hike, GDP, and a key inflation reading:
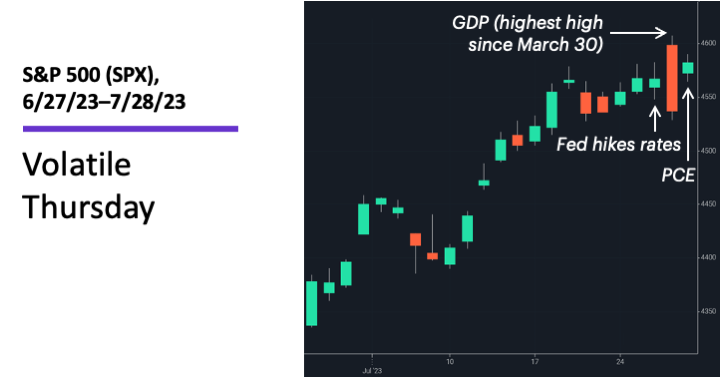
Source: Power E*TRADE. (For illustrative purposes. Not a recommendation.) Note: It is not possible to directly invest in an index.
The headline: Market on track for fifth-straight up month as interest rates hit 22-year high.
The fine print: Last week both Q2 GDP and durable goods orders topped estimates, while weekly jobless claims were weaker than expected, again showing the economy’s resilience in the face of one of the Fed’s most aggressive rate-hike campaigns in history.
The number: 4.1%, the year-over-year increase in the core PCE Price Index, the Fed’s preferred inflation gauge. That was below the 4.2% estimate, and down from 4.6% a month earlier.
The move: Last Wednesday, Silicon Motion Technology (SIMO) jumped 82% intraday to $95.16 after Chinese regulators approved the company’s sale to MaxLinear (MAXL). The stock then pulled back 33% to close at $65.35—and fell 20% to $52.51 on Thursday—as MaxLinear announced it was terminating the deal.
The scorecard: Post-earnings rallies from Alphabet (GOOGL) and Meta (META) helped the Nasdaq 100 (NDX) tech index lead the market last week:
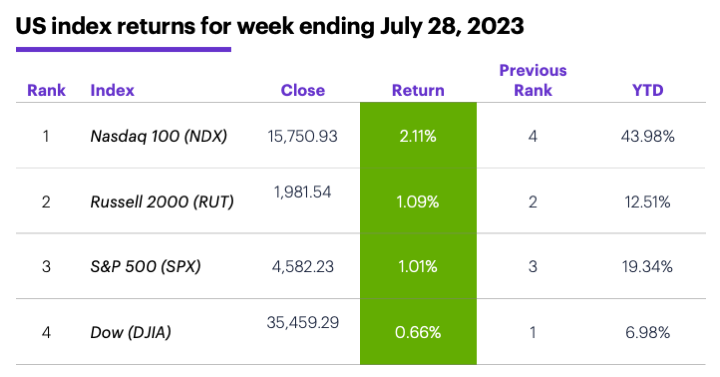
Source (data): Power E*TRADE. (For illustrative purposes. Not a recommendation.)
Sector returns: The strongest S&P 500 sectors last week were communication services (+6.9%), materials (+1.8%), and energy (+1.7%). The weakest sectors were utilities (-2.1%), real estate (-1.8%), and health care (-0.9%).
Stock movers: Vicor (VICR) +58% to $93.70 on Wednesday, North American Construction (NOA) +32% to $24.85 on Thursday. On the downside, Shyft (SHYF) -36% to $13.43, and Perficient (PRFT) -26% to $66.99, both on Thursday.
Futures: September WTI crude oil (CLU3) extended its rally, topping $80 for the first time since mid-April, and closing Friday at $80.58. August gold (GCQ3) ended the week slightly lower at $1,960.40. Week’s biggest gainers: September heating oil (HOU3) +7.7%, September orange juice (OJU3) +5.7%. Week’s biggest losers: August ethanol (ZKQ3) -7%, September lumber (LBSU3) -5.5%.
Coming this week
The name of the game this week is jobs:
●Monday: Chicago PMI
●Tuesday: S&P Global Manufacturing PMI, ISM Manufacturing Index, Job Openings and Labor Turnover Survey (JOLTS), Construction Spending
●Wednesday: ADP Employment Change, Total Vehicle Sales
●Thursday: Challenger Job Cuts, Productivity and Labor Costs, S&P Global Services PMI, ISM Services Index, Factory Orders
●Friday: Employment Report
When more than 100 companies are releasing their numbers on a Friday, you know earnings season is in full swing. More than 1,300 announcements are scheduled—including Apple and Amazon. Here’s a sample:
•Monday: ON Semiconductor (ON), Arista Networks (ANET), Lattice Semiconductor (LSCC), Rambus (RMBS)
•Tuesday: Pfizer (PFE), Rockwell Automation (ROK), Molson Coors (TAP), Toyota (TM), Uber (UBER), Advanced Micro Devices (AMD), Match (MTCH), Starbucks (SBUX), SolarEdge (SEDG)
•Wednesday: CVS (CVS), Kraft Heinz (KHC), Phillips 66 (PSX), Yum Brands (YUM), DoorDash (DASH), Etsy (ETSY), Occidental Petroleum (OXY), PayPal (PYPL), Qualcomm (QCOM), Qorvo (QRVO), Sunrun (RUN), Shopify (SHOP)
•Thursday: Anheuser Busch (BUD), ConocoPhillips (COP), EPAM Systems (EPAM), Hyatt (H), Kellogg (K), Moderna (MRNA), Apple (AAPL), Airbnb (ABNB), Amazon (AMZN), Booking (BKNG), Block (SQ)
•Friday: Dominion Energy (D), Fluor (FLR), XPO (XPO), iRobot (IRBT)
Check the Active Trader Commentary each morning for an updated list of earnings announcements, IPOs, economic reports, and other market events.
Less than 5% below all-time highs
A week ago we noted the SPX had, as of July 19, retraced 81% of its January–October 2022 downtrend. At that point, the index was less than 5% below its January 2022 record close of 4,796.56. (It ended last week 4.5% below that milestone.) The following table shows how long it took the SPX to close at a new all-time high after other times it fell into a bear market and then climbed to within 5% of its pre-bear record close.
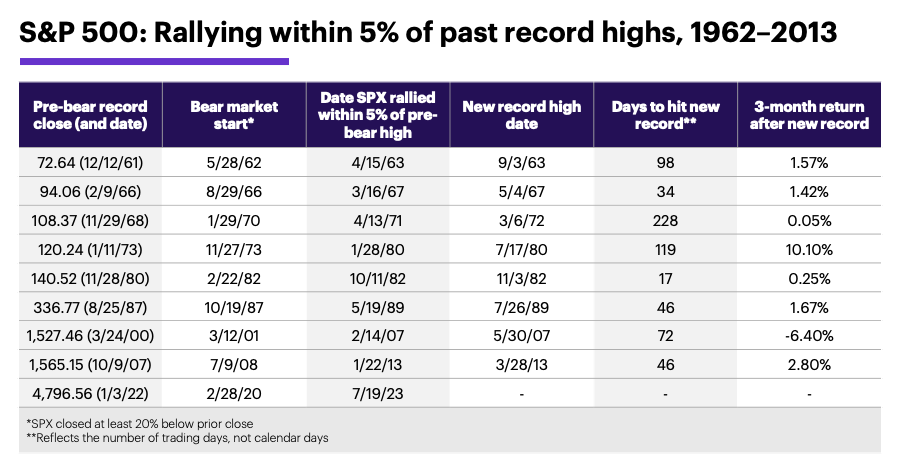
Source (data): Power E*TRADE. (For illustrative purposes. Not a recommendation.) Note: It is not possible to directly invest in an index.
The numbers suggests traders should be patient about the market reaching new highs, and realistic about what may happen when it does. Although in one instance it took the SPX only 17 trading days to hit a new record high after rallying to within 5% of the previous record close, it took 228 trading days—nearly 11 months—in another. The median wait time was 59 trading days, or a little less than three months.
Finally, the SPX’s average three-month return since 1956 is 2%.1 The final column shows that after the SPX established a new record close, its return over the next three months was less than 2% six out of eight times—a reminder that headline-grabbing milestones (“New all-time highs!”) don’t always translate into larger near-term gains.
Click here to log on to your account or learn more about E*TRADE's trading platforms, or follow the Company on Twitter, @ETRADE, for useful trading and investing insights.
1 All figures reflect S&P 500 daily closing prices, January 1956–July 2023. “Three-month return” represents 63 trading days, which, depending on the months in question, may sometimes be less than a three-month calendar period (e.g., June 15 to September 15). Supporting document available upon request.