Bulls up at halftime
- Strongest-ever H1 for NDX, 2nd-strongest for SPX since 1999
- Real estate leads last week, oil extends consolidation
- This week: Jobs report, FOMC minutes, Fourth of July
The second half of 2023 has a tough act to follow.
Although it still trails the Nasdaq 100 (NDX) tech index (and the Nasdaq Composite) by a wide margin this year, the S&P 500 (SPX) just wrapped up its second-strongest first half since 1999, and its second-biggest June rally since 1985:
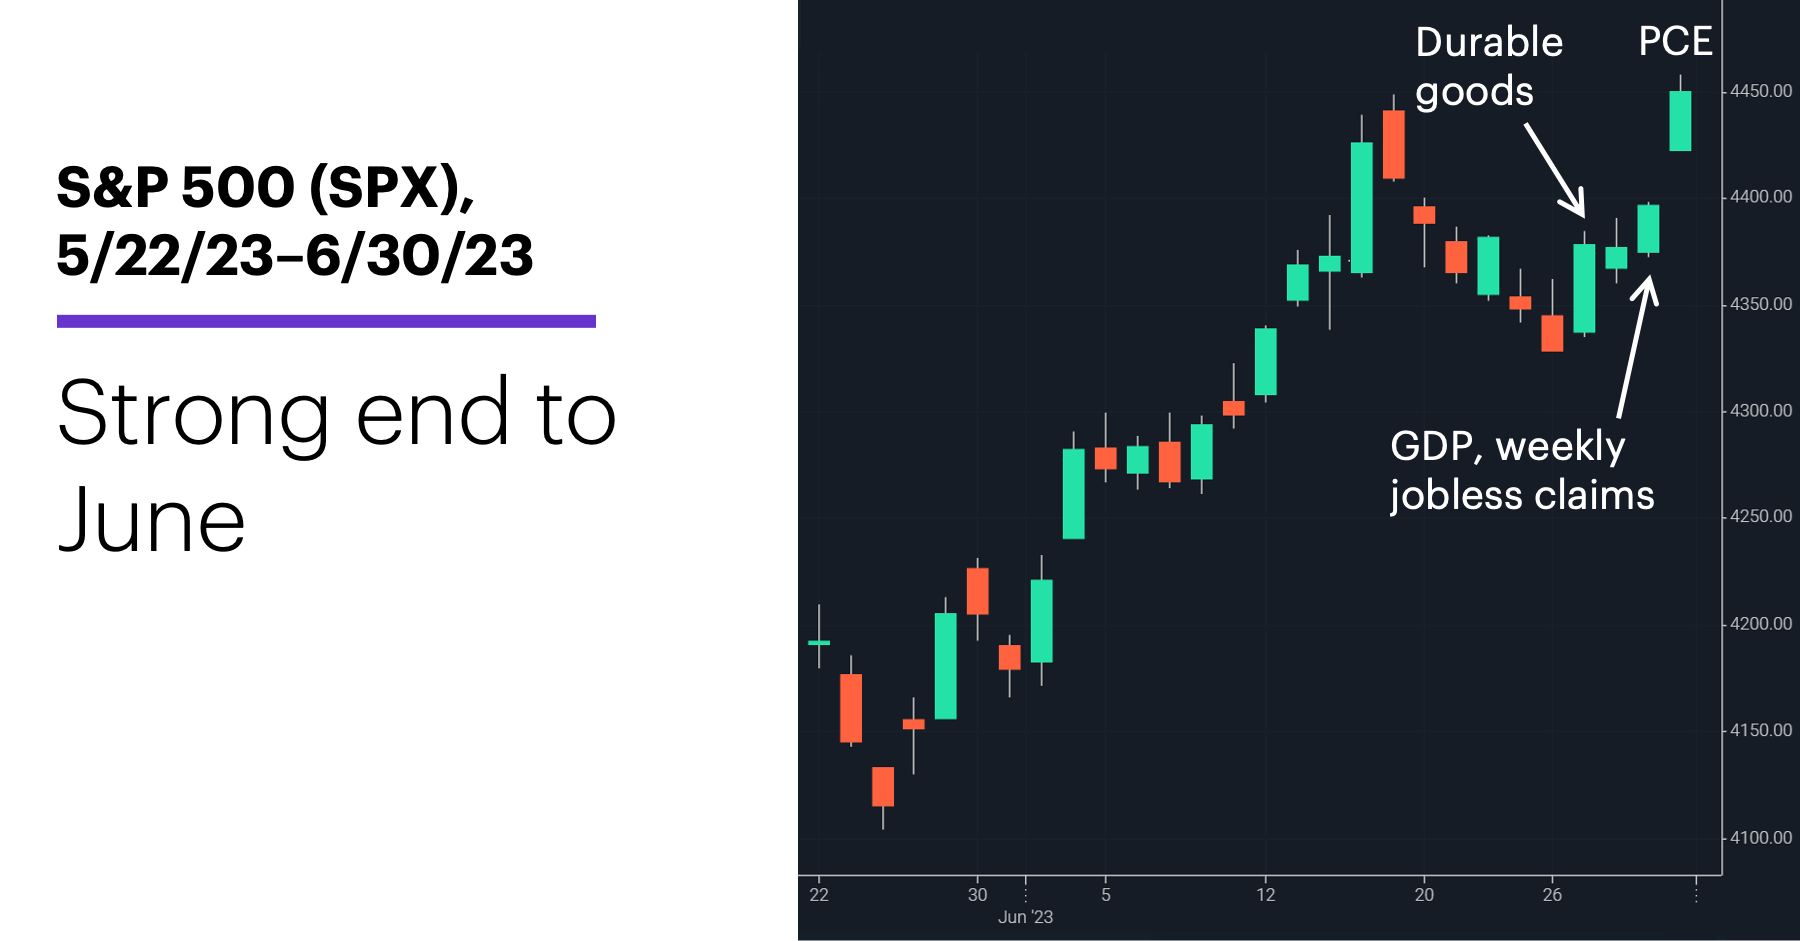
Source: Power E*TRADE. (For illustrative purposes. Not a recommendation.) Note: It is not possible to directly invest in an index.
The headline: Fed keeps pushing—and so does the stock market.
The fine print: The Fed has doubled down on higher interest rates, setting its sights specifically on cooling a strong labor market. Almost all of last week’s economic data, including a lower-than-expected number of weekly jobless claims, strong durable goods orders, and an upwardly revised Q1 GDP, suggest the economy continues to hum along, supported by a confident consumer.
The number: 4.6%, the year-over-year reading in the core PCE Price Index (the Fed’s preferred inflation barometer), released on Friday. That was down from 4.7% a month earlier.
The move: The Nasdaq 100 (NDX) tech index posted the biggest first-half rally in its history—38.8%—with a big assist from excitement over AI. Morgan Stanley analysts recently discussed how things may shake out in the AI space1—both for industries disrupted by the technology, and those poised to harness it.
The scorecard: It’s still far behind the NDX and SPX for the year, but the small-cap Russell 2000 (RUT) led the market last week:
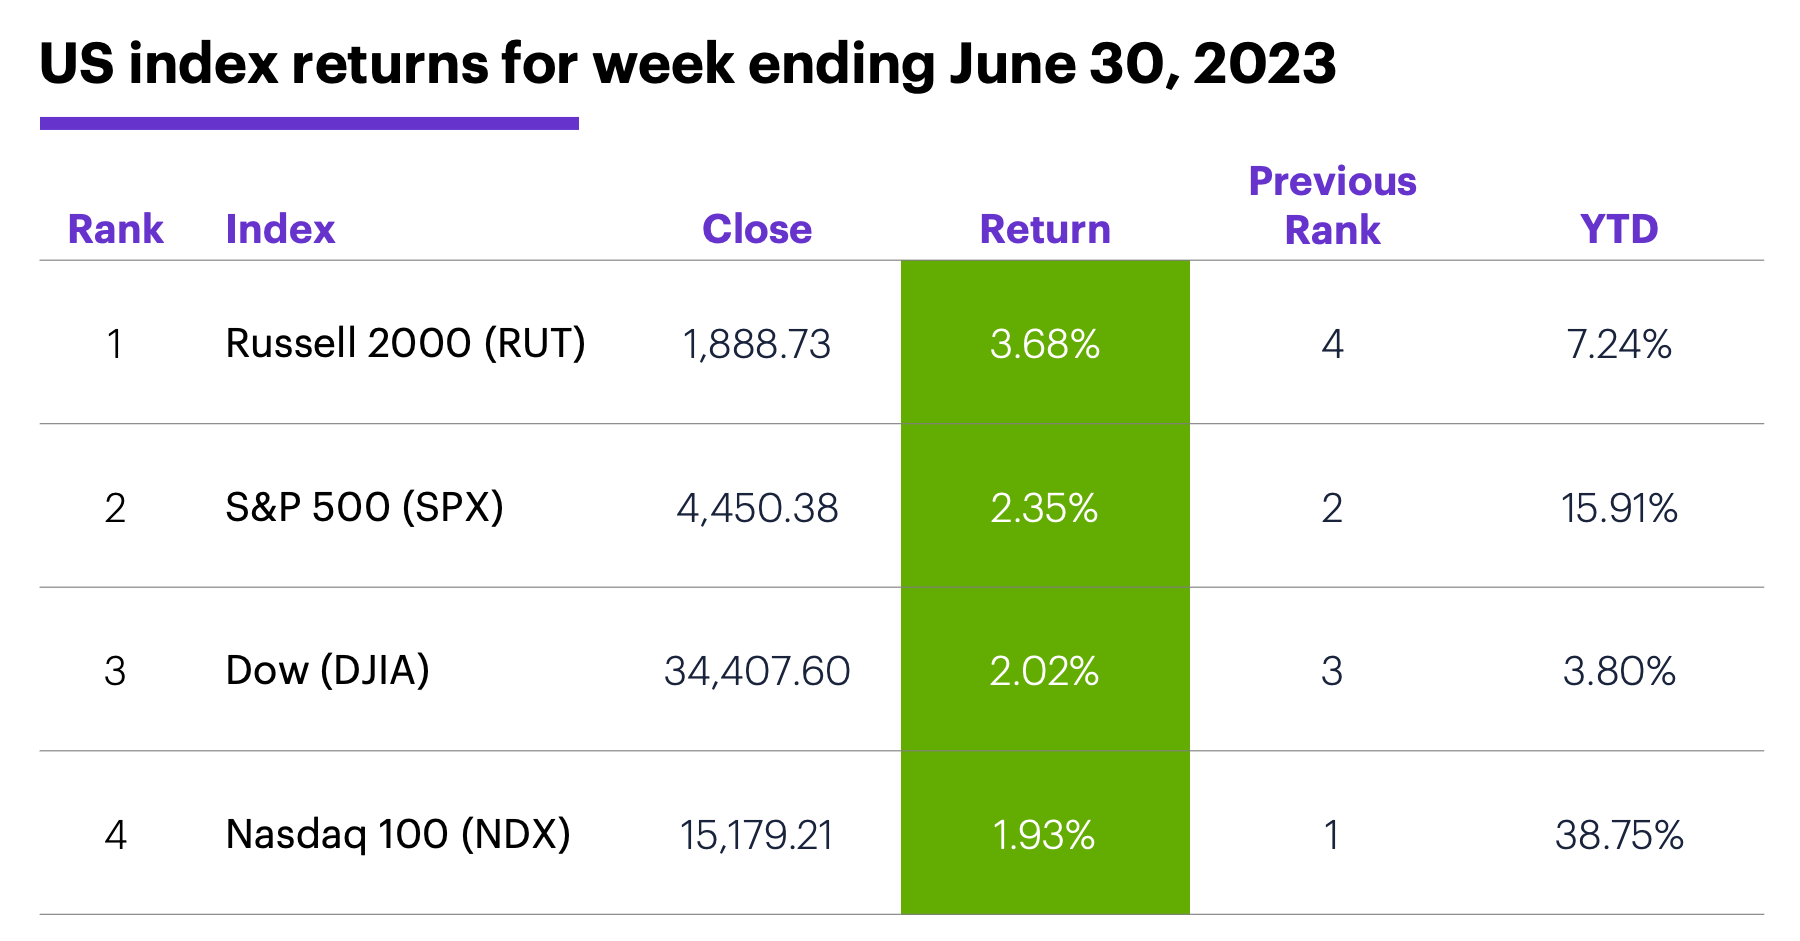
Source (data): Power E*TRADE. (For illustrative purposes. Not a recommendation.)
Sector returns: The strongest S&P 500 sectors last week were real estate (+5.1%), energy (+4.8%), and materials (+4%). The weakest sectors were communication services (+0.4%), consumer staples (+0.6%), and health care (+0.6%).
Stock movers: Acelyrin (SLRN) +35% to $23.90 on Monday, Sigilon Therapeutics (SGTX) +438% to $21.15 on Thursday. On the downside, Fibrogen (FGEN) -83% to $2.71 on Monday, BioXcel Therapeutics (BTAI) -64% to $6.39 on Thursday.
Futures: Another up-and-down week for August WTI crude oil (CLQ3) ended with the market modestly higher at $70.50. August gold (GCQ3) fell to a 16-week intraday low of $1,900.60 last Thursday, then bounced Friday to end the week only slightly lower at $1,926.50. Week’s biggest up moves: December soybean oil (ZLZ3) +7.3%, August feeder cattle (GFQ3) +5.8%. Week’s biggest down moves: December corn (ZCZ3) -15.9%, September wheat (ZWU3) -12.8%.
Coming this week
It may be a holiday shortened week, but there is no shortage of numbers, including the monthly jobs report on Friday.
●Monday: S&P Global Manufacturing PMI, ISM Manufacturing Index, Construction Spending, US equity markets close early (1 p.m. ET) for July 4th holiday
●Tuesday: US markets closed July 4th holiday (limited trading hours for some futures markets)
●Wednesday: ADP Employment Change, Factory Orders, FOMC minutes
●Thursday: Challenger Job Cut report, ADP Employment Change, Trade deficit, S&P Global Services PMI, ISM Services Index, Job Openings and Labor Turnover Survey (JOLTS)
●Friday: Employment Report
This week’s earnings include:
●Thursday: Levi Strauss (LEVI)
●Friday: AZZ (AZZ)
Check the Active Trader Commentary each morning for an updated list of earnings announcements, IPOs, economic reports, and other market events.
After the fireworks
July has been an up month for the SPX in 22 of the past 38 years, but that modest “bullish” tendency owes much to recent history. The SPX has had a positive July return in 10 of the past 11 years, including eight in a row since 2015, and it’s also had the biggest average return (3.3%) of any month over the past decade:
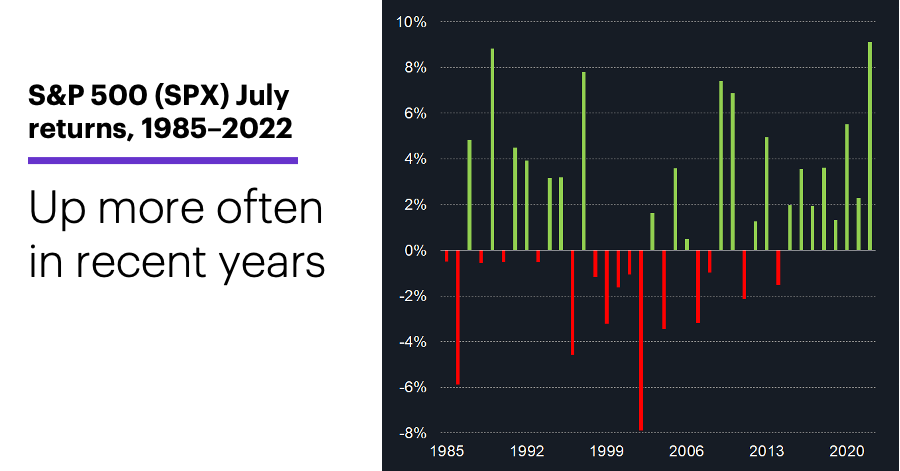
Source (data): Power E*TRADE. (It is not possible to invest in an index)
Before that, things were more of a mixed bag, with July negative 16 times and positive just 14 times from 1985–2014.2
Interesting sidebar: Today is the first trading day of July, a day on which the SPX has closed higher 50 times in the past 67 years, including 18 of the past 20 years, and every year since 2011.2 Bulls didn’t appear to be particularly eager to get back to work immediately after the Fourth of July, though. Since 1956, the SPX has closed down 34 times and up 33 times the day after the holiday.
Click here to log on to your account or learn more about E*TRADE's trading platforms, or follow the Company on Twitter, @ETRADE, for useful trading and investing insights.
1 MorganStanley.com. Key Lessons as AI Goes Mainstream. 6/27/23.
2 All figures reflect S&P 500 (SPX) monthly and daily closing prices, 1956–2023. Supporting document available upon request.