Market pivots into earnings season
- Stocks rebound, inflation cools (except for oil prices)
- Small caps and tech lead, muted response to initial earnings
- This week: Retail sales, housing, full week of earnings
With the latest inflation data in the rearview mirror, traders will get a chance to focus on a different type of data—corporate earnings—with the market near its highest levels in more than 15 months.
The S&P 500 (SPX) erased its most recent pullback with its second-biggest weekly gain since March, and on Friday hit its highest price since April 5, 2022:
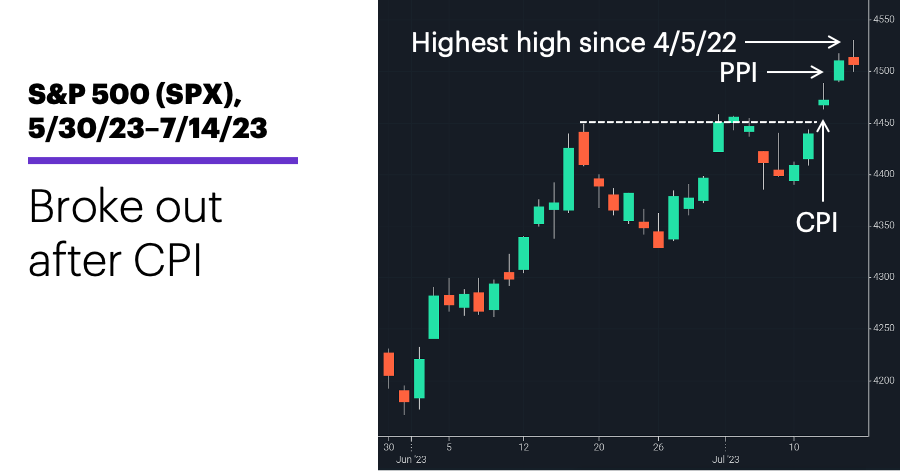
Source: Power E*TRADE. (For illustrative purposes. Not a recommendation.) Note: It is not possible to directly invest in an index.
The headline: Stocks break out into earnings season.
The fine print: The SPX pushed above its June and July highs after last Wednesday’s Consumer Price Index (CPI) showed the pace of inflation slowed for a second-straight month, but the Fed is still on track to raise rates on July 27.
The move: Nvidia (NVDA), the poster child for AI-fueled tech momentum, closed lower on Friday, but not before hitting a new all-time high. The stock gained 7% for the week and is up 49% since May 24. The stock has rallied 55% since May 24. Morgan Stanley & Co. recently shared some thoughts about which companies may benefit from the AI boom over time—and which may get left behind.1
The scorecard: The Russell 2000 (RUT) was the week’s strongest index, despite selling off sharply on Friday:
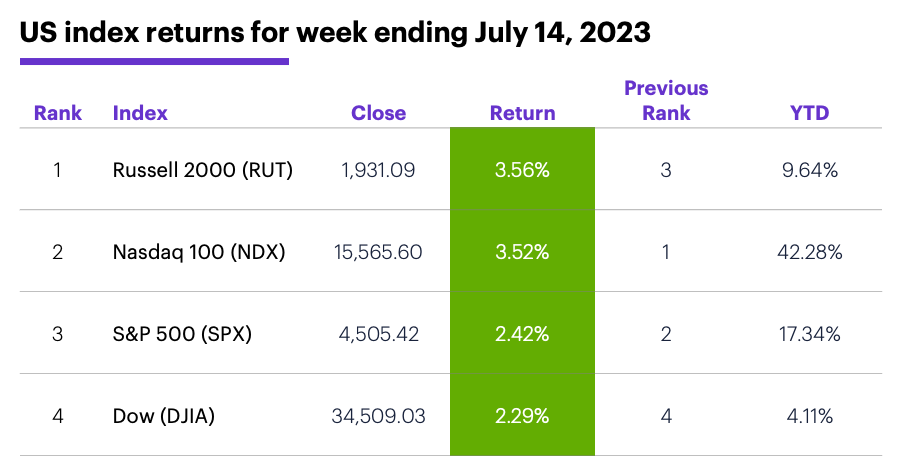
Source (data): Power E*TRADE. (For illustrative purposes. Not a recommendation.)
Sector returns: The strongest S&P 500 sectors last week were consumer discretionary (+3.3%), communication services (+3.3%), and information technology (+2.7%). The weakest sectors were energy (+0.6%), consumer staples (+1.2%), and financials (+2%).
Stock movers: Redfin (RDFN) +24% to $15.54 and Skillz (SKLZ) +24% to $12.13, both on Tuesday. On the downside, Silk Road Medical (SILK) -29% to $23.32 on Wednesday, Viasat (VSAT) -28% to $30.74 on Thursday.
Futures: August WTI crude oil (CLQ3) pulled back on Friday to $75.42, but still posted its biggest two-week gain in more than three months. August gold (GCQ3) closed at a four-week high of $1,965 last Thursday, ending its best week since early April at $1,964.40. Week’s biggest up moves: August ethanol (ZKQ3) +8.3%, November canola (RSX3) +8.2%. Week’s biggest down moves: December corn (ZCZ3) -15.9%, September wheat (ZWU3) -12.8%.
Coming this week
The first full week of earnings season is still heavy on big banks, but it also includes Tesla, Netflix, airlines, and big pharma. Here’s a sample:
●Monday: Equity Lifestyle Properties (ELS)
●Tuesday: Bank of America (BAC), Hasbro (HAS), Lockheed Martin (LMT), Morgan Stanley (MS), PNC (PNC), Synchrony Financial (SYF)
●Wednesday: Goldman Sachs (GS), Halliburton (HAL), US Bancorp (USB), Alcoa (AA), Crown Castle (CCI), F5 (FFIV), International Business Machines (IBM), Netflix (NFLX), Tesla (TSLA), United Airlines (UAL)
●Thursday: American Airlines (AAL), Abbott Labs (ABT), Biogen (BIIB), Freeport-McMoRan (FCX), Fifth Third Bank (FITB), Johnson & Johnson (JNJ), KeyCorp (KEY), Newmont (NEM), Taiwan Semiconductor (TSM), Intuitive Surgical (ISRG)
●Friday: American Express (AXP), Schlumberger (SLB)
This week’s numbers include:
●Monday: Empire State Manufacturing Index
●Tuesday: Retail Sales, Industrial Production, Capacity Utilization, Business Inventories, NAHB Housing Market Index
●Wednesday: Housing Starts and Building Permits
●Thursday: Existing Home Sales, Leading Economic Indicators Index
Check the Active Trader Commentary each morning for an updated list of earnings announcements, IPOs, economic reports, and other market events.
Momentum check
Last week was one of the strongest for US stocks this year, but in addition to the RUT’s sharp sell-off on Friday, there were a couple of other signals of flagging momentum. Despite mostly better-than-expected numbers at the start of earnings season, the SPX traded in a narrow range on Friday and gave up an early rally to close down for the day.
Some traders may have noticed Friday’s slump followed a day the Cboe Volatility Index (VIX) closed higher as the SPX pushed to its highest level in more than 50 trading days—a pattern that has, historically, been followedy by a short-term pause or market weakness.2
Click here to log on to your account or learn more about E*TRADE's trading platforms, or follow the Company on Twitter, @ETRADE, for useful trading and investing insights.
1 MorganStanley.com. The Double-Edged Sword of AI Technologies.
2 Figures reflect S&P 500 (SPX) and Cboe Volatility Index (VIX) daily price data, 1990 – 2023. Supporting document available upon request.