Implied volatility
- Implied volatility (IV) a key component of options prices
- It’s a forecast of future price volatility
- High IV can pump up options prices, low IV can deflate them
Ever bought an option, watched the underlying stock do exactly what you thought it would—and lost money, anyway?
You may have been right about price direction, and wrong about volatility—specifically, implied volatility (IV).
A good way to get a handle on IV is to compare it to that other type of volatility—historical volatility (HV), which is simply the amount of price movement that has occurred in a market over a given period.
There are many ways to measure it, but regardless of the specific calculation, HV will vary depending on the time window being analyzed—for example, the HV for the past two weeks will likely be different than the HV for the past two years. The most important thing to remember about HV is that it measures past (known) price movement.
Higher IV typically translates into higher options prices, while lower IV usually results in lower options prices.
Implied volatility, on the other hand, is the estimate of future (unknown) price movement that is reflected in an option’s price: The more future price movement traders expect, the higher the IV; the less future price movement they expect, the lower the IV.
A key takeaway from this basic principle is that, other pricing factors aside, higher IV typically translates into higher options prices (premiums), while lower IV usually results in relatively lower options prices. In other words, if traders expect a higher level of volatility—call it uncertainty—they will raise options prices to offset the heightened risk. That’s high IV.
One of the most practical examples of this is the IV increase that often occurs before an earnings announcement—the outcome is uncertain, surprises can result in big stock moves, and IV often jumps as a result. Similarly, it typically drops—often dramatically—not too long after the announcement comes out.
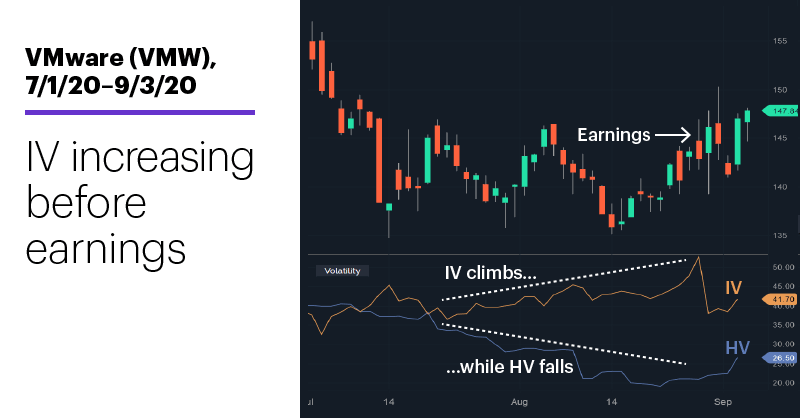
Take a look at the following chart of VMware (VMV), which released earnings after the close on August 27:
Source: Power E*TRADE
While HV drifted lower in the month before earnings (reflecting the stock’s mostly sideways price action), IV increased steadily throughout this period and accelerated right before the announcement. In situations like this, traders who buy options in the final days before earnings can sometimes find themselves with only a small gain—or even a loss—even if the stock moves in the direction they expected.
The reason: Extremely high IV can pump up options prices to such a degree that the stock move isn’t enough to compensate for the drop in the option’s value caused by the post-announcement IV decline (notice the sharp down move in the IV line right after earnings). Right on price, wrong on volatility.
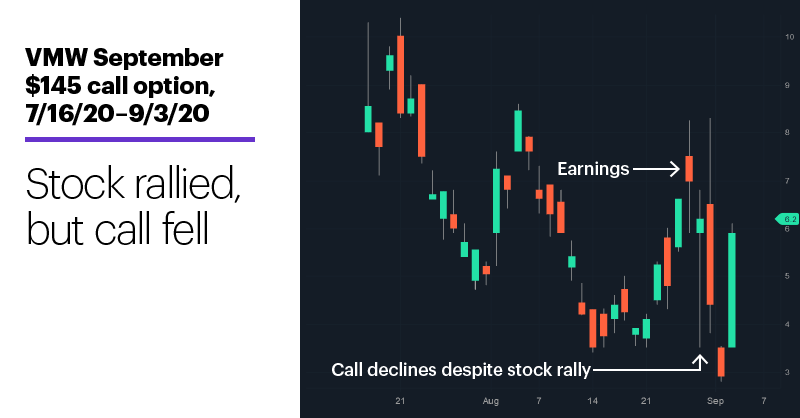
The following chart shows how these dynamics played out in the VMW September $145 call option:
Source: Power E*TRADE
The day after earnings were announced, the call closed down (and traded sharply lower intraday) even though the stock was up more than 2%.
This is why experienced traders, whenever possible, try to buy options with relatively low IV and short options with relatively high IV. Volatility tends to cycle between highs and lows (its so-called “mean-reverting” tendency) rather than trend higher or lower for extended periods of time. As a result, options buyers can sometimes improve their chances of a successful trade by purchasing low-IV options, since (barring any adverse factors) a cyclical rebound in IV should increase their value. The same is true, in reverse, for traders who sell high-IV options.
In addition to the main options chain screen in Power E*TRADE, several LiveAction scans highlight stocks with relatively high or low IV, including those with IV that is notably above or below their HV.
Click here to log on to your account or learn more about E*TRADE's trading platforms, or follow the Company on Twitter, @ETRADE, for useful trading and investing insights.