Fibonacci retracements
- Fibonacci number series has several unique mathematical properties
- Some traders use ratios of Fibonacci numbers to forecast support and resistance
The Fibonacci series, named after medieval Italian mathematician Leonardo Fibonacci and described in his 1202 book Liber Abaci,1 is a number progression in which each successive number is the sum of the two immediately preceding it: 0, 1, 2, 3, 5, 8, 13, 21, 34, 55, 89, 144…and so on. Fibonacci adherents use properties of the series to forecast potential trend retracement and extension levels—support or resistance levels at which prices may reverse or pause.
Some traders find significance in ratios of certain Fibonacci numbers because they seem to appear in certain natural phenomena (e.g., the distribution of flower petals and leaves, the progression of a nautilus shell spiral), as well as in art and architecture (proportions found in the Parthenon and the Great Pyramid).2
Although many scientists take issue with such interpretations,3 some traders believe that the Fibonacci series also makes its presence felt in market action. The Fibonacci sequence is entrenched in the technical analysis world, and many traders and analysts reference Fibonacci-related price points in their work.
Fibonacci ratios
A key characteristic of the Fibonacci series is that as it progresses, the ratio of a number in the sequence divided by the immediately preceding number (e.g., 144/89) approaches 1.618—the so-called “Golden Mean” or “Golden Ratio”. The inverse, 0.618, has a similar significance.
The most commonly referenced Fibonacci ratios are 0.382, 0.5, 0.618, 1.382, and 1.618. Some traders use additional ratios, such as 0.236, 0.786, and 2.618.
Fibonacci retracements
While some traders use fairly complex variations and combinations of Fibonacci numbers, the most common approach is to use Fibonacci ratios to calculate potential price targets, especially trend retracements.
Here’s how it works: If a stock rallied from a low of $40 to $70, potential Fibonacci retracement levels could be calculated by:
1. Multiplying the size of this move ($70 – $40 = $30) by Fibonacci ratios—e.g., 0.382, 0.5, and 0.618.
2. Subtracting these results from the high (or the highest closing price) of the rally.
Here are the resulting retracement levels for this example:
1. 38.2% Fibonacci retracement: $70 – ($30*0.382) = $58.54
2. 50% Fibonacci retracement: $70 – ($30*0.50) = $55
3. 61.8% Fibonacci retracement: $70 – ($30*0.618) = $51.46
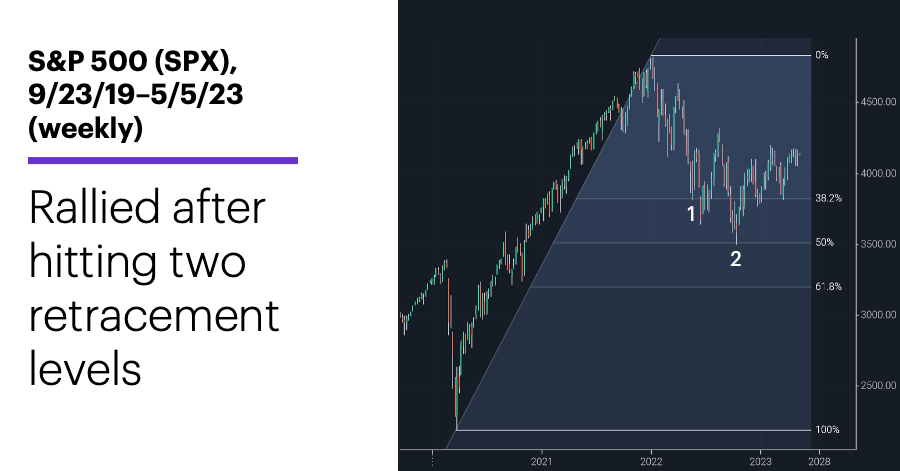
In practice, some traders may look for prices to pause or reverse (if only temporarily) at these levels. The following weekly chart show the S&P 500 (SPX) reversed after hitting two Fibonacci levels in the process of retracing much of its March 2020–January 2022 rally:
Source: Power E*TRADE
First, the index rallied more than 9% in less than two weeks after falling to the 38.2% retracement level in May 2022 (point 1). Then, after reaching the 50% retracement level in October 2022 (point 2), the index rallied as much as 20% by late-January 2023.
In contrast to Fibonacci retracements, Fibonacci extension levels are used to forecast potential price moves in the same direction as the previous price swing. For example, if a stock rallied off a swing low at $35, climbed to $55, and then pulled back to $50, a Fibonacci trader expecting another leg to the uptrend might estimate the size of that move in terms of a Fibonacci ratio—say, by multiplying the recent up move ($20) by 0.382, and adding the result ($7.64) to the high of the move ($55) to generate a price target of $62.64.
One tool among many
Bottom line, sometimes price moves reverse or pause near Fibonacci levels, sometimes they don’t. But because they are so widely watched—much the same way 50- and 200-day moving average levels are—many traders monitor the price action around them, especially if they align with other indicators or signals they’re using.
Note: Power E*TRADE includes several Fibonacci analysis charting tools, including retracement levels.
Click here to log on to your account or learn more about E*TRADE's trading platforms, or follow the Company on Twitter, @ETRADE, for useful trading and investing insights.
1 Britannica.com. Fibonacci, Italian Mathematician. 4/20/20.
2 ScienceFriday.com. Fibonacci Sequence—A Handy Mathematical Approach For Looking At Evolution! 9/6/18.
3 LiveScience.com. Phi: The Golden Ratio. 11/15/19.