Market extends pullback
- Market falls for third week, Dow negative for year
- Fed inflation rises, rates tag 15-week high, oil swings
- This week: Home prices, manufacturing and service-economy data
A holiday-shortened week turned out to provide more than enough time for bears to remind everyone that January’s rally didn’t mean stock-market volatility had been permanently exiled.
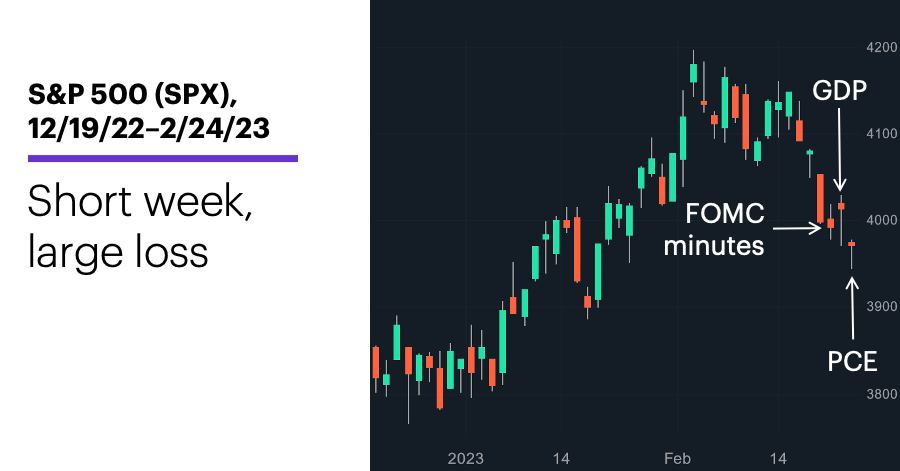
Stocks had already been in a slump since tagging a five-month high in early February, but last week the S&P 500 (SPX) fell more in four days than it has in any week since early December:
Source: Power E*TRADE. (For illustrative purposes. Not a recommendation.) Note: It is not possible to directly invest in an index.
The headline: February retreat accelerates.
The fine print: Minutes from the most recent FOMC meeting confirmed the Fed is inclined to push interest rates higher than previously estimated1—and keep them there for longer than investors had hoped—because of inflation. And Friday’s hotter-than-anticipated inflation data effectively confirmed that confirmation.
The number: 0.6%, January’s month-over-month increase in the Fed’s preferred inflation gauge, the PCE Price Index. That was higher than December’s reading (which was also revised upward on Friday), and above expectations. But Q4 GDP was revised downward, from 2.9% to 2.7%.
The move: 10-year T-note yield hit a 15-week high of 3.98% last week, and is on pace for its biggest monthly increase since September.
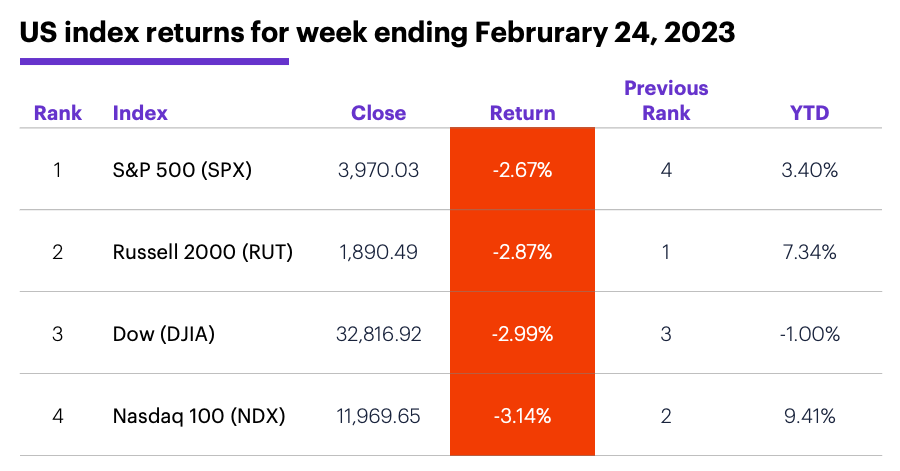
The scorecard: Last week’s loss pushed the Dow Jones Industrial Average (DJIA) into negative territory for the year:
Source (data): Power E*TRADE. (For illustrative purposes. Not a recommendation.)
Sector returns: The strongest S&P 500 sectors last week were consumer staples (-0.2%), materials (-1.1%), and utilities (-1.8%). The weakest sectors were communication services (-4.8%), consumer discretionary (-4.4%), and real estate (-4.2%).
Stock movers: NeoGenomics (NEO) +25% to $16.63 and Remitly (RELY) +22% to $14.24, both on Thursday. On the downside, Inogen (INGN) -31% to $15.89 and Vicor (VICR) -28% to $40.85, both on Friday.
Futures: April WTI crude oil (CLJ3) closed at a 13-day low of $73.85/barrel last Wednesday, then rallied to close Friday more or less unchanged for the week at $76.32. April gold (GCJ3) continued its February slide, ending last week at its lowest level ($1,817.10/ounce) since December 22.
Coming this week
This week’s numbers include more housing numbers, along with the latest manufacturing and service-economy readings:
●Monday: Durable Goods Orders, Pending Home Sales
●Tuesday: Wholesale and Retail Inventories (advance), Goods Trade Balance (advance), S&P Case-Shiller Home Price Index, FHFA House Price Index, Chicago PMI, Consumer Confidence
●Wednesday: S&P Global Manufacturing PMI, ISM Manufacturing Index, Construction Spending
●Thursday: Productivity and Labor Costs
●Friday: S&P Global Services PMI, ISM Services Index, Vehicle Sales
More retail earnings season highlight the week’s calendar, but some notable tech names also make an appearance:
●Monday: Axsome Therapeutics (AXSM), Beam Therapeutics (BEAM), Freshpet (FRPT), Reata Pharmaceuticals (RETA), Novavax (NVAX), Occidental Petroleum (OXY), Workday (WDAY), Zoom Video Communications (ZM)
●Tuesday: Agilent Technologies (A), AutoZone (AZO), Blink Charging (BLNK), Duolingo (DUOL), First Solar (FSLR), HP (HPQ), Rivian (RIVN), Ross Stores (ROST), Urban Outfitters (URBN), Verisk Analytics (VRSK)
●Wednesday: Dollar Tree (DLTR), Horizon Therapeutics (HZNP), Kohl’s (KSS), Lowe’s (LOW), Salesforce.com (CRM), Plug Power (PLUG), Snowflake (SNOW), Splunk (SPLK)
●Thursday: Best Buy (BBY), Big Lots (BIG), Anheuser Busch InBev (BUD), Burlington Stores (BURL), Kroger (KR), Macy’s (M), C3 AI (AI), Broadcom (AVGO), ChargePoint (CHPT), Costco (COST), Dell Technologies (DELL), Hewlett Packard Enterprise (HPE), Nordstrom (JWN), Marvell Technology (MRVL), Zscaler (ZS)
●Friday: Hibbett (HIBB), Hurco (HURC)
Check the Active Trader Commentary each morning for an updated list of earnings announcements, IPOs, economic reports, and other market events.
End-of-week VIX signal
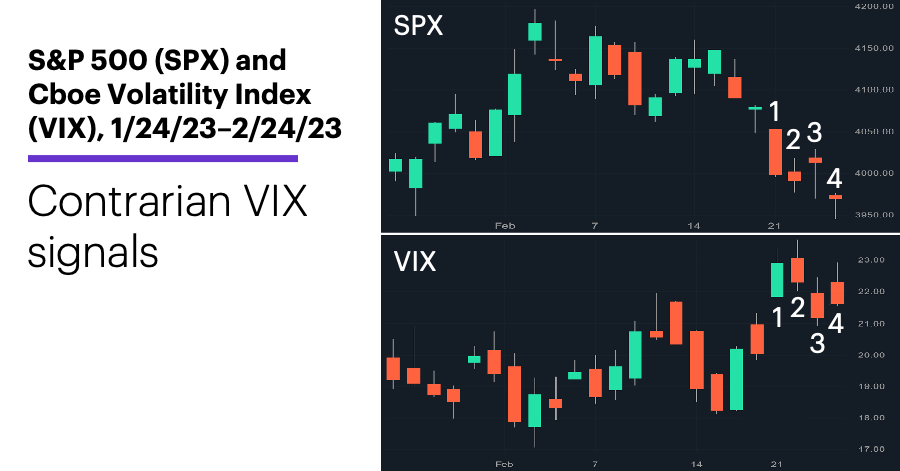
If the stock market starts this week with a rebound, traders who monitor the Cboe Volatility Index (VIX) may not be surprised. The VIX did a few interesting things last week, including giving a potentially short-term bullish signal on Friday.
The SPX started last week with a 2% decline on Tuesday (1), which was accompanied, as would be expected, by a jump in the VIX, which typically moves in the opposite direction of the stock market:
Source: Power E*TRADE. (For illustrative purposes. Not a recommendation.) Note: It is not possible to invest in an index.
But when the SPX closed lower on Wednesday (2), the VIX closed lower instead of higher, suggesting the options market was less “anxious” at the end of the day, despite the stock market’s additional losses. Next, the SPX closed higher on Thursday (3), while the VIX closed lower, following its typical pattern.
But on Friday (4), when the SPX closed at a fresh low for the week, the VIX closed lower than it did on Tuesday—again, signaling the options market expected less volatility, even though the SPX was 0.7% lower than it had been three days earlier.
Similar episodes since 1990 have been followed by larger-than-average short-term gains:2 The SPX’s average two-day return after days like Friday was 0.4% (vs. its overall two-day average return of 0.1%), and it also rallied more often—59.1% of the time after the VIX signals vs. 55.3% of the time for all two-day periods.
Click here to log on to your account or learn more about E*TRADE's trading platforms, or follow the Company on Twitter, @ETRADE, for useful trading and investing insights.
1 CNBC.com. Fed minutes show members resolved to keep fighting inflation with rate hikes. 2/22/23.
2 Reflects S&P 500 (SPX) and Cboe Volatility Index (VIX) daily prices, 1990–2022. “Days like Friday” refers to a day 1) the SPX makes it lowest low and close of the past three days, and 2) the VIX makes a lower low and close than three days ago (132 previous examples since January 1990). Supporting document available upon request.