Split decision for stocks
- Stocks mixed, inflation readings surprise to upside
- Small caps climb, broad market slips, oil and energy slide
- This week: FOMC minutes, Fed inflation, retail earnings
The S&P 500 (SPX) is coming off its first two-week losing streak of the year as traders and investors continue to take the pulse of inflation—and how it could influence the Federal Reserve’s stance on interest rates.
After rallying more than 1% last Monday, the SPX slumped toward the end of the week, while the Consumer Price Index (CPI) and Producer Price Index (PPI) both came in hotter than expected and Fed officials fueled concerns about future rate hikes:
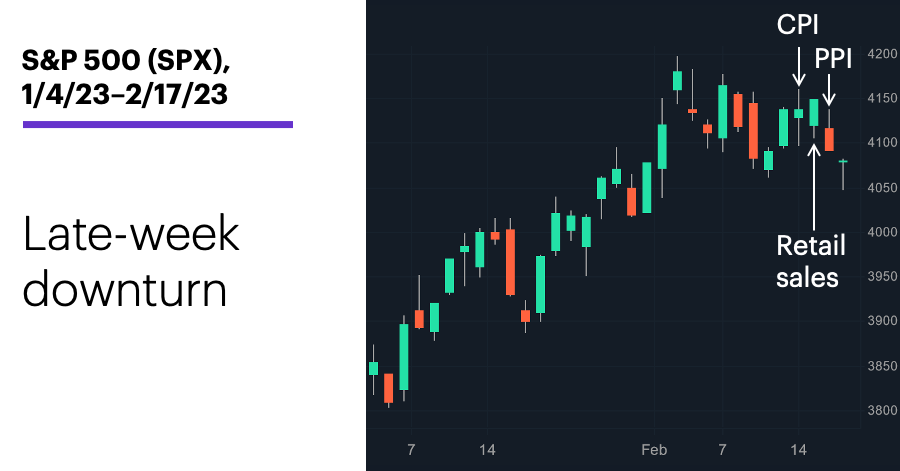
Source: Power E*TRADE. (For illustrative purposes. Not a recommendation.) Note: It is not possible to directly invest in an index.
The headline: Broad market slips, inflation numbers bump up against “expectation gap.”
The fine print: The CPI and PPI both rose less in January (year-over-year) than they did in December, but they also increased more than analysts had expected. And while the market seemed to take Tuesday’s CPI in stride, it weakened after Thursday’s PPI—perhaps influenced by comments from FOMC board members James Bullard and Loretta Mester. Both had favored a 0.5% (rather than a 0.25%) rate hike at the Fed’s last meeting, and Bullard said he saw the possibility of a 0.5% increase at the next one.1
The number: 3%, the increase in retail sales in January reported last Wednesday—nearly twice the forecast, and a dramatic reversal from December’s 1.1% decline.
The scorecard: The SPX and Dow lost ground, but the Russell 2000 (RUT) and Nasdaq 100 (NDX) ended the week in positive territory:
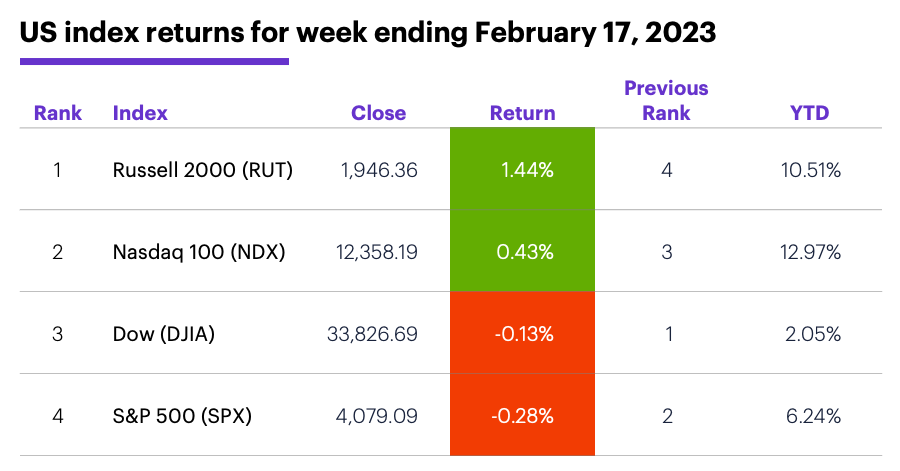
Source (data): Power E*TRADE. (For illustrative purposes. Not a recommendation.)
Sector returns: The strongest S&P 500 sectors last week were consumer discretionary (+1.6%), consumer staples (+0.9%), and utilities (+0.9%). The weakest sectors were energy (-6.9%), real estate (-1.4%), and materials (-1%).
Stock movers: The Trade Desk (TTD) +33% to $66.30 on Wednesday, TravelCenters Of America (TA) +71% to $84.43 on Thursday. On the downside, Credo Technology (CRDO) -47% to $10.30 on Wednesday, RingCentral (RNG) -23% to $37.07 on Thursday.
Futures: A nearly 3% Friday sell-off sent April WTI crude oil (CLJ3) to an eight-day low of $76.55/barrel. April gold (GCJ3) extended its pullback, hitting a year-to-date low of $1,827.70/ounce early Friday before closing at $1,850.20. Week’s biggest up moves: February Micro bitcoin (MBTG3) +14%, February Micro ether (ETHG3) +11.9%. Week’s biggest down moves: April natural gas (NGJ3) -9.2%, March lumber (LBSH3) -8.6%.
Coming this week
In addition to the minutes from the last FOMC meeting, this week has the latest Fed inflation reading (PCE Price Index) and the second estimate of Q4 GDP:
●Tuesday: S&P Global Manufacturing and Services PMIs (flash), Existing Home Sales
●Wednesday: FOMC minutes
●Thursday: Chicago Fed National Activity Index, Q4 GDP (second estimate)
●Friday: Personal Income and Spending, PCE Price Index, Consumer Sentiment (check out Morgan Stanley’s “U.S. Consumers: What’s Coming for Spending in 2023?”), New Home Sales
The retail portion of earnings season kicks off this week:
●Tuesday: Palo Alto Networks (PANW), Molson Coors (TAP), Toll Brothers (TOL), SBA Communications (SBAC), Coinbase (COIN), Home Depot (HD), LGI Homes (LGIH), Walmart (WMT), Keysight Technologies (KEYS), Medtronic (MDT)
●Wednesday: Ultra Clean Holdings (UCTT), TJX Companies (TJX), Nvidia (NVDA), Etsy (ETSY), eBay (EBAY), Five9 (FIVN), Teladoc (TDOC), NetApp (NTAP), Sunrun (RUN)
●Thursday: Alibaba (BABA), American Tower (AMT), Intellia Therapeutics (NTLA), Block (SQ), BigCommerce (BIGC), CubeSmart (CUBE), Newmont (NEM), Keurig Dr. Pepper (KDP), Wayfair (W), Penumbra (PEN), Moderna (MRNA), Intuit (INTU), Novocure (NVCR), Li Auto (LI)
●Friday: Turning Point Brands (TPB), Evergy (EVRG)
Check the Active Trader Commentary each morning for an updated list of earnings announcements, IPOs, economic reports, and other market events.
President’s Day stock market pattern
With a stacked earnings schedule and a few notable new releases on the calendar, perhaps this week will be more interesting than the typical post-President’s Day trading slog. Since 1971, the SPX has posted a net gain in the four days after President’s Day 26 times and lost ground 26 times:
1. -0.04% average return
2. 3.4% maximum gain (in 1974)
3. -6.87% maximum loss (in 2009)
That’s weaker—but less volatile—than the market’s typical four-day performance. The SPX has rallied in 56% of all four-day periods since 1971, with an average return of 0.14%, a maximum gain of 18%, and a maximum loss of -28.5%.2
Click here to log on to your account or learn more about E*TRADE's trading platforms, or follow the Company on Twitter, @ETRADE, for useful trading and investing insights.
1 CNBC.com. Dow closes 400 points lower as hot inflation, comments from Fed’s Bullard raise rate hike fears” Live updates. 2/16/23.
2 All figures reflect S&P 500 (SPX) daily prices, 1971–2022. Supporting document available upon request.