A look inside December’s trading pattern
- December a historically bullish month for stocks
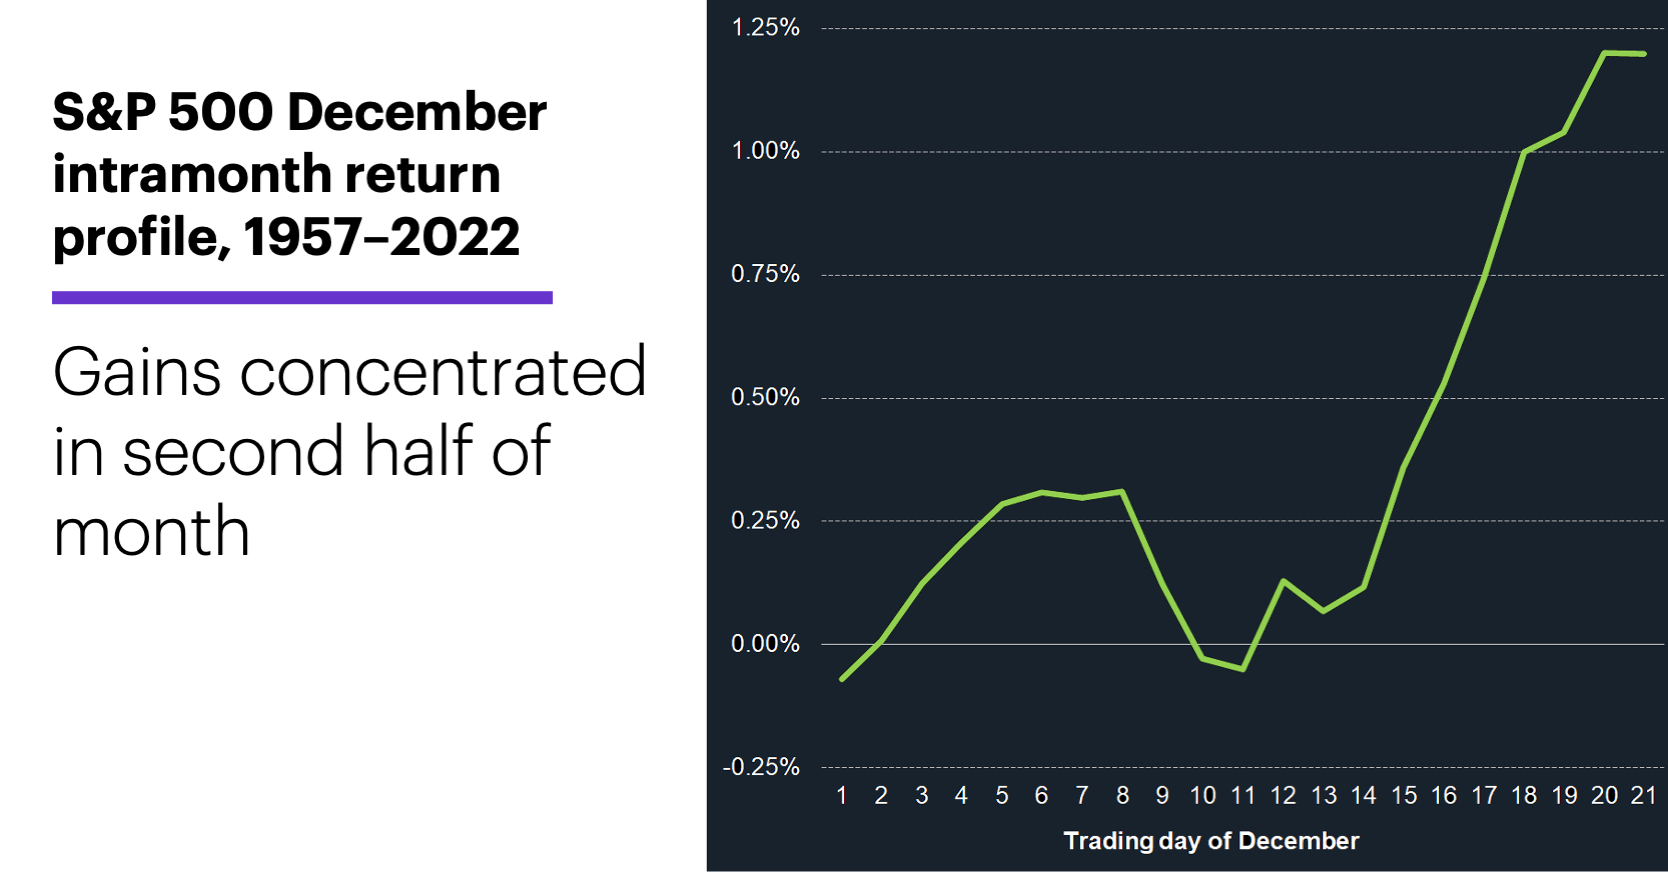
- Gains more common in latter half of month
- SPX often in the red at mid-month
In the markets, small details often have large implications.
For example, while December can accurately be described as one of the more bullish months of the year for stocks, that doesn’t mean it’s bell-to-bell buying every year.
In addition to the reality that the S&P 500’s (SPX) December return has ranged anywhere from +10.8% to -11.4% since 1957, the following chart highlights another aspect of December’s historical performance:
Source: Power E*TRADE. (For illustrative purposes. Not a recommendation. Note: It is not possible to invest directly in an index.))
This chart represents the SPX’s average percentage gain or loss throughout December (1957 to 2022), measured from the final closing price of November to the closing prices of each of the next 21 trading days.1
The lesson here is that December’s gains, when they occur, have often been concentrated in the second half of the month. The first two weeks of December were characterized by up-and-down trading that resulted in a slightly negative average return for the month at trading days 10 and 11. After that, though, the SPX tended to move more consistently to the upside. In fact, the SPX’s average net return for the first 10 trading days of December was -0.03%, while its net return over the next 10 trading days was 1.2%.
There’s no downside to consulting market “seasonals,” but like any tool, they have their limitations and nuances. Understanding those details can help traders make the most of these patterns when they do play out in the market.
Market Mover Update: After Tuesday’s breakout above the October highs, on Wednesday December gold futures (GCZ3) topped $2,050 for the first time since May. The benchmark 10-year T-note yield dropped below 4.3% for the first time in 10 weeks.
Today’s numbers include (all times ET): Weekly jobless claims (8:30 a.m.), Personal Income and Outlays (8:30 a.m.), PCE Price Index (8:30 a.m.), Chicago PMI (9:45 a.m.), Pending Home Sales Index (10 a.m.), EIA Natural Gas Report (10:30 a.m.), OPEC meeting.
Today’s earnings include: Cracker Barrel (CBRL), Kroger (KR), Ambarella (AMBA), Salesforce (CRM), Dell Technologies (DELL), Marvell Technology (MRVL), Ulta Beauty (ULTA), VMware (VMW).
Click here to log on to your account or learn more about E*TRADE's trading platforms, or follow the Company on Twitter, @ETRADE, for useful trading and investing insights.
1 All figures reflect S&P 500 (SPX) daily closing prices, 1/2/57-12/30/22. Note: Because the number of trading days in December can vary from year to year, the 21st trading day depicted on the chart may occasionally represent the first trading day of January. Supporting document available upon request.