Stocks close in on another record year
- Santa Claus Rally: Stocks bounce back from virus dip, hit new highs
- Fed inflation gauge posts biggest yearly increase in more than 39 years
- This week: Housing numbers, five full days of trading
Another COVID jolt, another hot inflation reading—and a stock market that’s fresh off a new record as it kicks off the final week of the year.
After dropping to an 11-day low last Monday amid Omicron uncertainty, the S&P 500 (SPX) marched higher to end the week with a record close on Thursday:
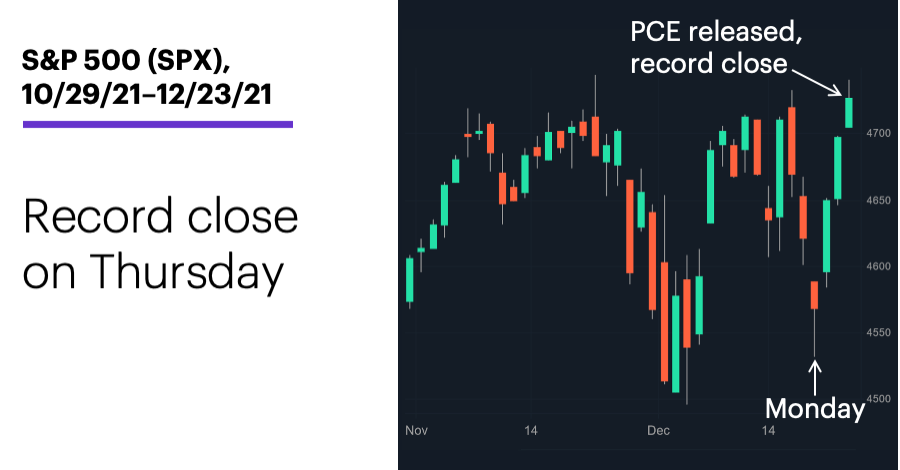
Source: Power E*TRADE. (For illustrative purposes. Not a recommendation.)
The headline: Inflation data fails to derail push to new milestone.
The fine print: The Fed’s go-to inflation gauge, the PCE Price Index, increased 5.7% year over year through November—in line with estimates, but still the biggest increase since July 1982. The market didn’t blink, though, as the SPX staged one of its bigger day-before-Christmas rallies after the number came out, gaining 0.6% on its way to Thursday’s record close.
The number: 4,743.84, the price the SPX has to hit this week to make 2021 the first year since 1995 that the index has pushed to a higher high every month of the year—and the first on record to hit a new all-time high every month of the year.
The scorecard: A strong tech rebound put the Nasdaq 100 (NDX) on top last week, and bumped it just ahead of the SPX in the year-to-date return race:
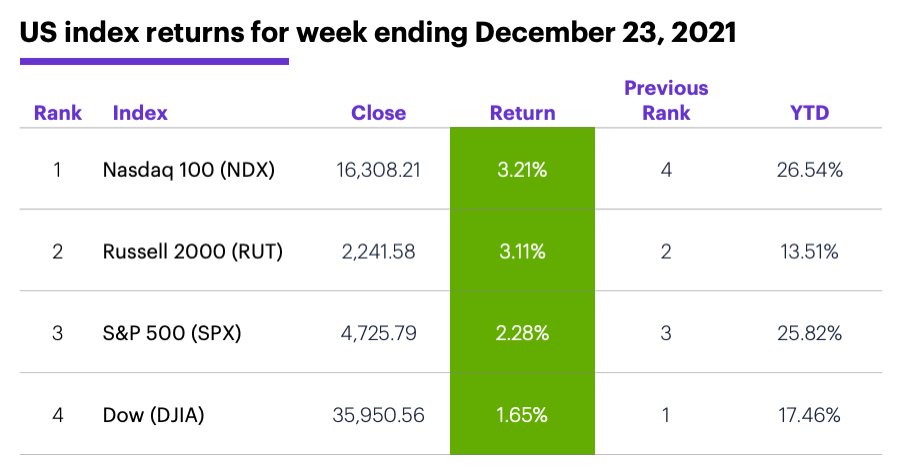
Source (data): Power E*TRADE. (For illustrative purposes. Not a recommendation.)
Sector roundup: The strongest S&P 500 sectors last week were consumer discretionary (+3.8%), information technology (+3.3%), and communication services (+2.5%). The weakest sectors were utilities (+0.2%), consumer staples (+0.6%), and financials (+1.1%).
Highlight reel: Verso (VRS) +35% to $27.04 on Monday, Rite Aid (RAD) +21% to $15.05 on Tuesday. On the downside, Insignia (ISIG) -35% to $11.50 on Monday, Allakos (ALLK) -90% to $8.55 on Wednesday.
Futures action: After tumbling more than 5% intraday to $66.12/barrel last Monday, February WTI crude oil (CLG2) rebounded to end the week at $73.79 barrel. February gold (GCG2) ended another congested week modestly higher at $1,811.70/ounce. Biggest up move: March palladium (PAH2), +9.3%. Biggest down move: January VIX (VSF2), -7.6%.
Coming this week
The final week of the year is relatively quiet on the economic front, but there are still five full days of trading (i.e., no Friday holiday closure, like last week):
●Tuesday: S&P Case-Shiller Home Price, FHFA House Price Index
●Wednesday: Goods Trade Balance, Advance Retail and Wholesale Inventories, Pending Home Sales
●Thursday: Weekly jobless claims, Chicago PMI
This week’s earnings include:
●Tuesday: Cal-Maine Foods (CALM)
Check the Active Trader Commentary each morning for an updated list of earnings announcements, IPOs, economic reports, and other market events.
A closer look at the January Effect
As we get ready for a new year, it’s a good time to put January’s reputation as a bullish month—and as a potential barometer for the market’s full-year performance—under the microscope.
The devil, as usual, is in the details.
Since 1960, the SPX has gained ground in January in 36 of 62 years—at 58%, that’s just the fifth-best percentage of any month:1
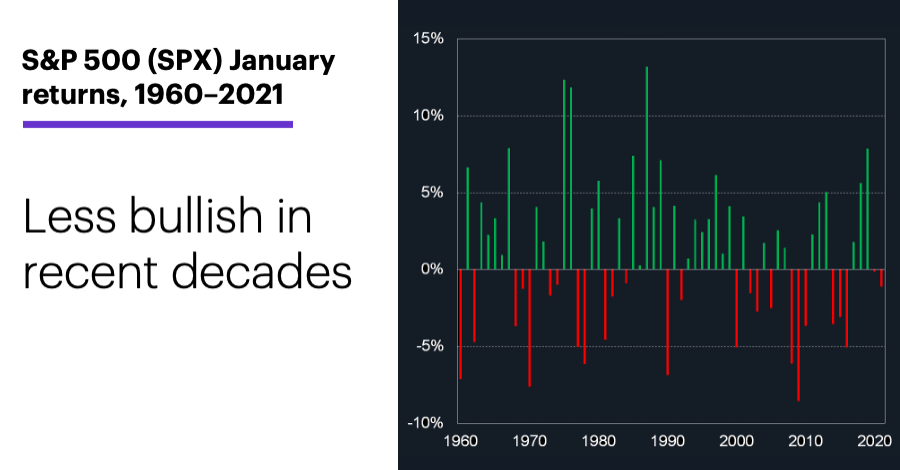
Source (data): Power E*TRADE. (For illustrative purposes. Not a recommendation.)
On the other hand, January’s median return since 1960 is 1.6%, which is the second-highest of any month. So, overall, not bad.
But it turns out most of that bullishness took place more than 30 years ago. The more recent trend, especially over the past 20 years, is much different:
1. From 1960–1991, January had the largest median SPX return (2%) of any month of the year, and the fourth-highest winning percentage (59%, up 19 of 32 years).
2. Since 1992, January has had only the fifth-best SPX median return (1.2%) and the seventh-highest winning percentage (57%).
3. Over the past 20 years, January has the worst median return (-0.64%), and is the only month that has declined more often than it has rallied (up in only nine of 20 years).1
And in terms of “As goes January, so goes the rest of the year,” well…
Since the SPX has been up 45 of the past 62 years (73% of the time), if you simply said at midnight on December 31, “This year is going to be an up year!” you would have been right nearly three out of four times.
Now, if you made your “up year” forecast only after the 36 Januaries that closed higher, you would have been right 31 times—an 86% accuracy rate. That sounds like there could be something to this January thing, until you find out that only 12 of the 26 down Januaries “predicted” a down year—a 46% accuracy rate.
But here’s a final twist: Of the SPX’s 10 worst years since 1960, eight started out with negative Januaries, and of the 11 times the SPX lost 4% or more in January, it ended the year in the red seven times.
Click here to log on to your account or learn more about E*TRADE's trading platforms, or follow the Company on Twitter, @ETRADE, for useful trading and investing insights.
1 Reflects S&P 500 closing price data from 12/30/59–1/29/21. Supporting document available upon request.