Oil move has precedent
- Monday oil rally interrupted recent sell-off
- Oil still up significantly from June-July lows
- Similar moves often followed by two-stage pattern
When a market makes an unexpected move, especially in unusual circumstances, it can make traders and investors feel like they’ve lost their bearings. Analyzing past examples can help provide some perspective.
For example, if the 13% sell-off in November WTI crude oil futures (CLX3) between September 26 and October 26 wasn’t dramatic enough, the market surged 4.3% on Monday—its third-biggest up day of the year:
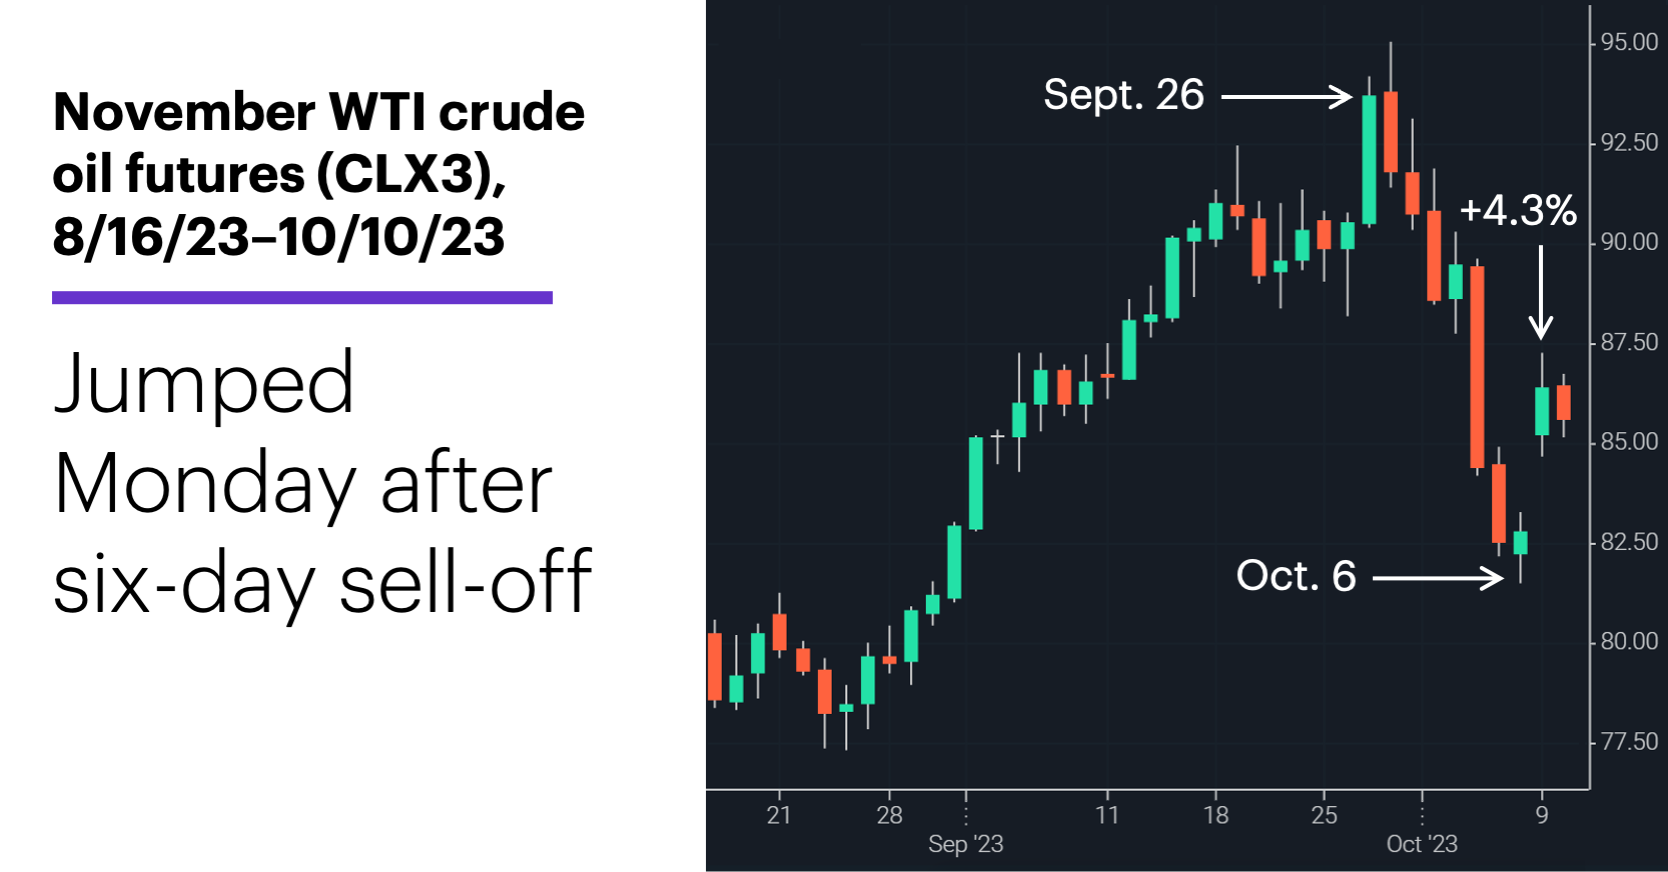
Source: Power E*TRADE. (For illustrative purposes. Not a recommendation.)
As unexpected as Monday’s move may have been, it’s not without precedent. Aside from the history of sharp (and sometimes brief) oil rallies unfolding amid geopolitical turmoil in the Middle East, crude oil has rallied 4% or more in a day after falling to its lowest level in at least a month 69 other times since 1986.1
Two of those moves occurred earlier this year, one in February and the other in September. The price action that followed them was similar—the market continued to rally for a few more days before moving sideways or lower:
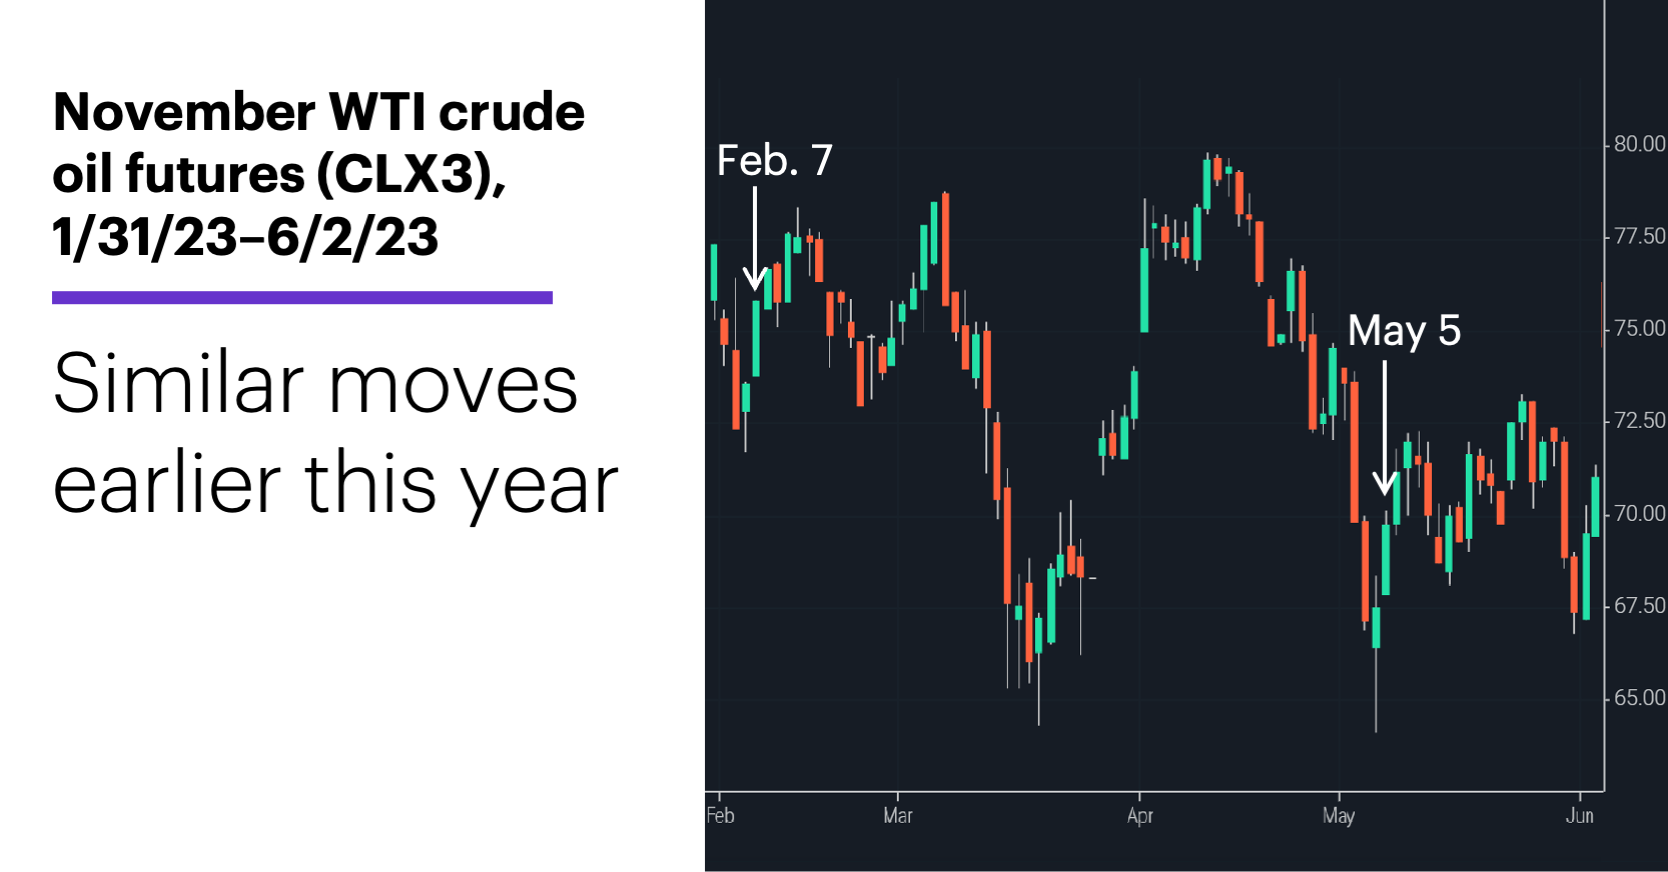
Source: Power E*TRADE. (For illustrative purposes. Not a recommendation.)
Of course, it’s unwise to read too much into two price moves. But looking at all 69 examples of this pattern shows the chart above may present a fairly representative picture of what the oil market has tended to do. In a nutshell, the typical move was for the market to move higher soon after the large up day before losing momentum:
•After five trading days, oil was higher 64% of the time with a median return of 2.1%
•After 10 trading days, oil was higher 51% of the time with a median return of 0.1%
•After 15 trading days, oil was higher 52% of the time with a median return of 0.5%
•After 20 trading days, oil was lower 51% of the time with a median return of -0.5%
The key detail is that although the market was higher after 10 and 15 days (+0.1 and +0.5, respectively), it wasn’t up as much as it was at the five-day mark (+2.1%), which means oil often declined after those first few days of additional upside.
One can never assume a market will always follow the “typical” path following a certain type of price action. Unique catalysts will dictate circumstances in any individual situation. But knowing what has happened in the past can help provide context—a reminder that what may appear to be unusual in the moment has happened many times before.
Today’s numbers include (all times ET): Producer Price Index (8:30 a.m.), Fed minutes (2 p.m.).
Today’s earnings: Karooooo (KARO).
Click here to log on to your account or learn more about E*TRADE's trading platforms, or follow the Company on Twitter, @ETRADE, for useful trading and investing insights.
1 Unless specified otherwise, all references to historical moves in crude oil reflect changes in the spot (cash) crude oil market rather than the crude oil futures market. The pattern consisted of a 4%-or-larger daily price gain no more than two trading days after price fell to its lowest level in at least 20 trading days. Supporting document available upon request.