The power of patience
- BG rallied Thursday on high relative call volume
- Stock near highest levels of past year
- Shares testing top of multi-week range
When stocks test the boundaries of consolidations, many traders intuitively think of trading the potential breakout move. And since traders on the wrong side of the market may want to exit their positions (and/or change direction), the potential exists for a short-term price surge.
A recent price move highlights some of the realities traders can face in these situations. Agribusiness company Bunge (BG) appeared on Thursday’s scan for high call-put ratios:
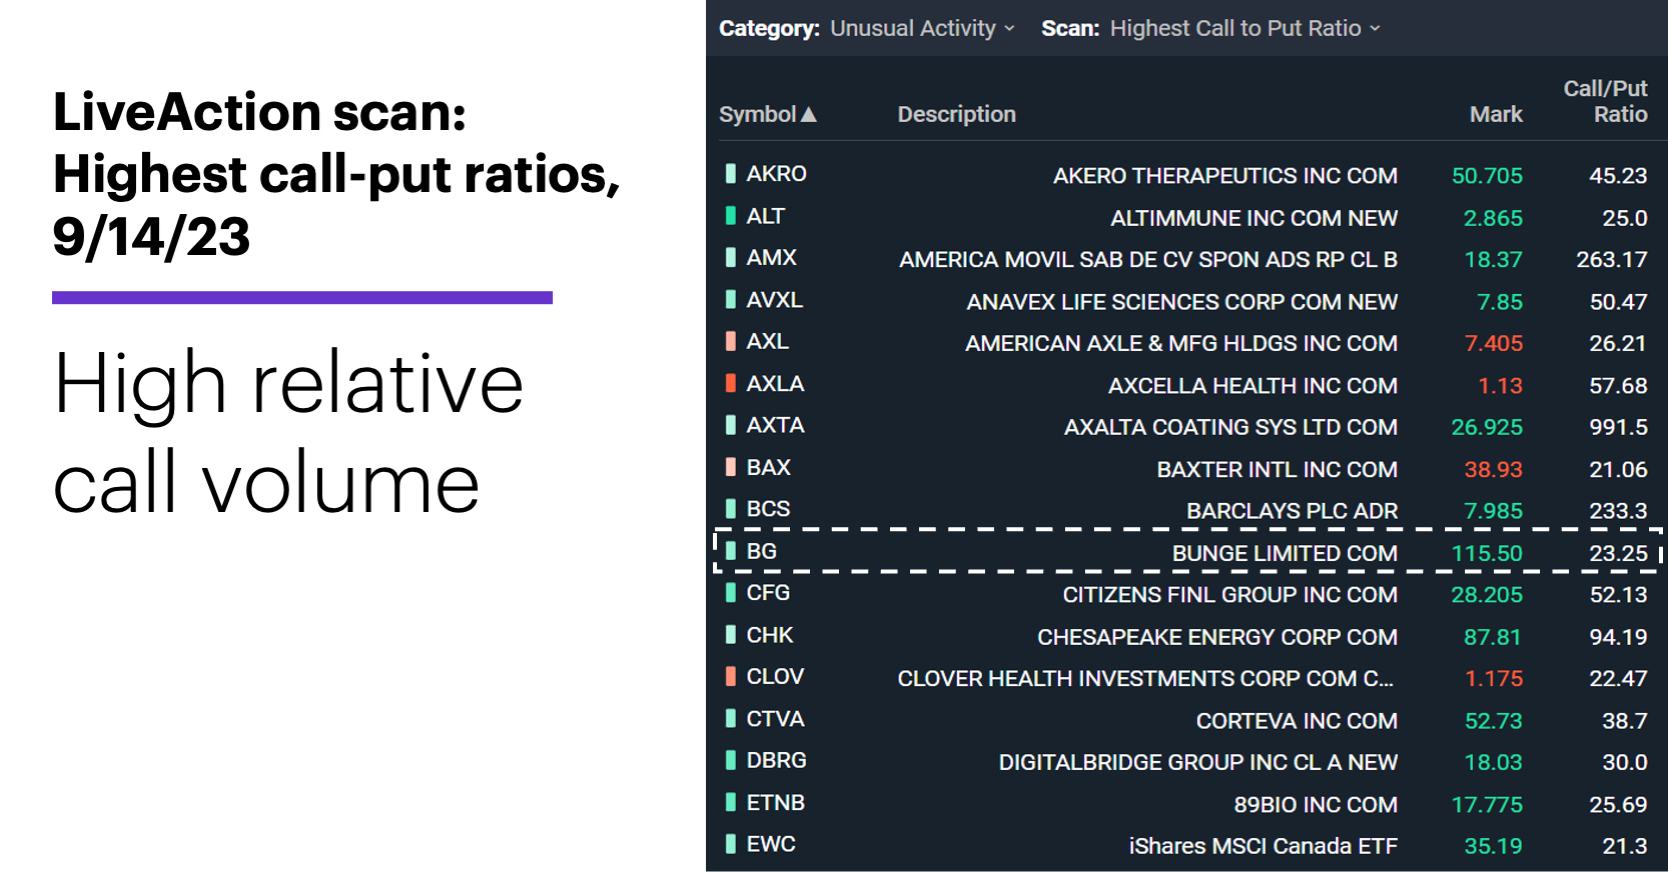
Source: Power E*TRADE. (For illustrative purposes. Not a recommendation.)
At the same time, the stock was outpacing the broad market with a 2%-plus intraday rally that pushed shares toward the top of a roughly five-week trading range, which represented the stock’s highest levels in more than a year.
The range formed after the stock rallied 26% off its late-June low, peaking at $115.98 on August 7—just three days after it broke out a brief consolidation. While traders who bought this breakout would have enjoyed three more days of upside, BG soon drifted lower, eventually retreating to the breakout level (and establishing the range low) before turning higher again:
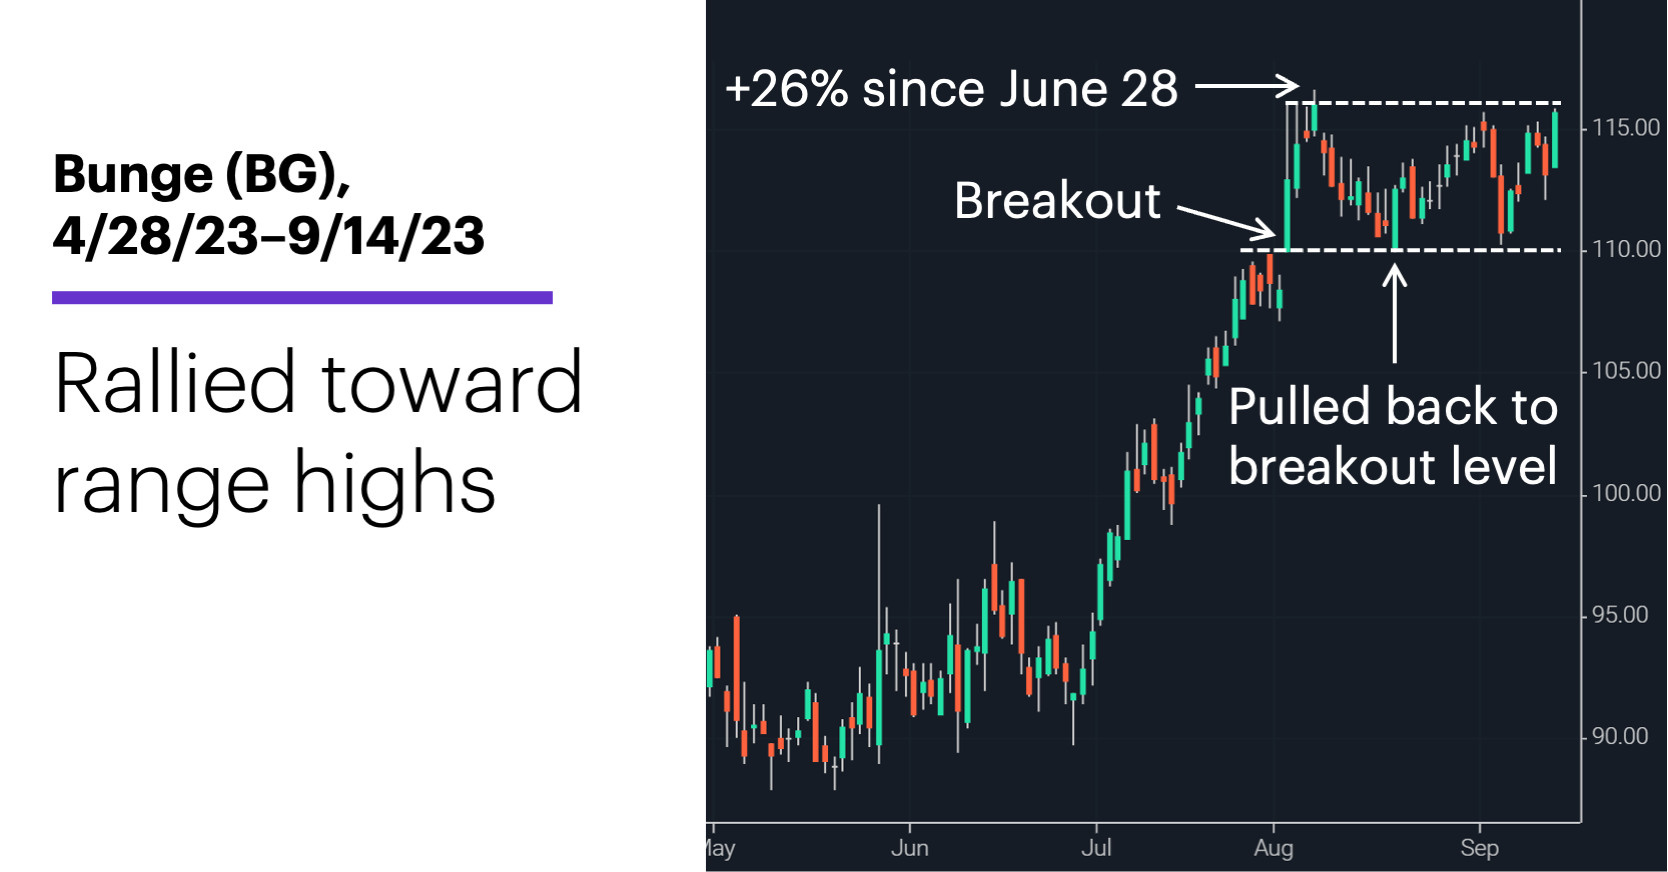
Source: Power E*TRADE. (For illustrative purposes. Not a recommendation.)
That general pattern is worth keeping in mind for traders inclined to reflexively trade breakouts, or even anticipate them when prices test the boundaries of a consolidation. While trading ranges, like trends, don’t last forever, the timing—and sustainability—of a breakout is always uncertain.
The chart illustrates how prices sometimes reverse, at least temporarily, after a strong price move—and test recent technical levels in the process. Also, analyzing BG’s price history provides some corroborating evidence about the way price moves often ebb and flow. Bunge has rallied 2% or more in a day to hit a 20-day (or longer) high 91 other times since 2001. Five days later the stock was lower 47 times and up only 44 times.1
This general dynamic is what prompts some traders to buy on pullbacks rather than breakouts. The risk of missing out on a move (because a pullback doesn’t occur) is often preferable to the risk of chasing a price move that could turn against you.
Market Mover Update: Wednesday’s Producer Price Index (PPI) showed higher-than-expected inflation at the wholesale level. High oil prices aren’t helping: October WTI crude oil futures (CLV3) topped $90/barrel yesterday. The market is at its highest level in more than 10 months.
AbbVie (ABBV) closed at an 18-week high on Wednesday (see “Tracking options”). The Cboe Volatility Index (VIX) closed at its lowest level (12.82) since January 2020.
Today’s numbers include (all times ET): Empire State Manufacturing Index (8:30 a.m.), Import and Export Prices (8:30 a.m.), Industrial Production (9:15 a.m.), Consumer Sentiment (10 a.m.).
Click here to log on to your account or learn more about E*TRADE's trading platforms, or follow the Company on Twitter, @ETRADE, for useful trading and investing insights.
1 Figures reflect Bunge (BG) daily prices, 2001-2023. Supporting document available upon request.