Breaking down a “big” trade
- OPCH bucked market weakness on high call volume
- Possible liquidation tempers bullish interpretation
- Oil sell-off tests potential support
Because large trades in relatively low-profile stocks are easier to spot, it can feed the tendency to make assumptions about what they “mean.”
Thursday morning Option Care Health (OPCH) topped the scan for unusual call volume, with more than 17,700 contracts changing hands—nearly 79 times its 226-contract average:
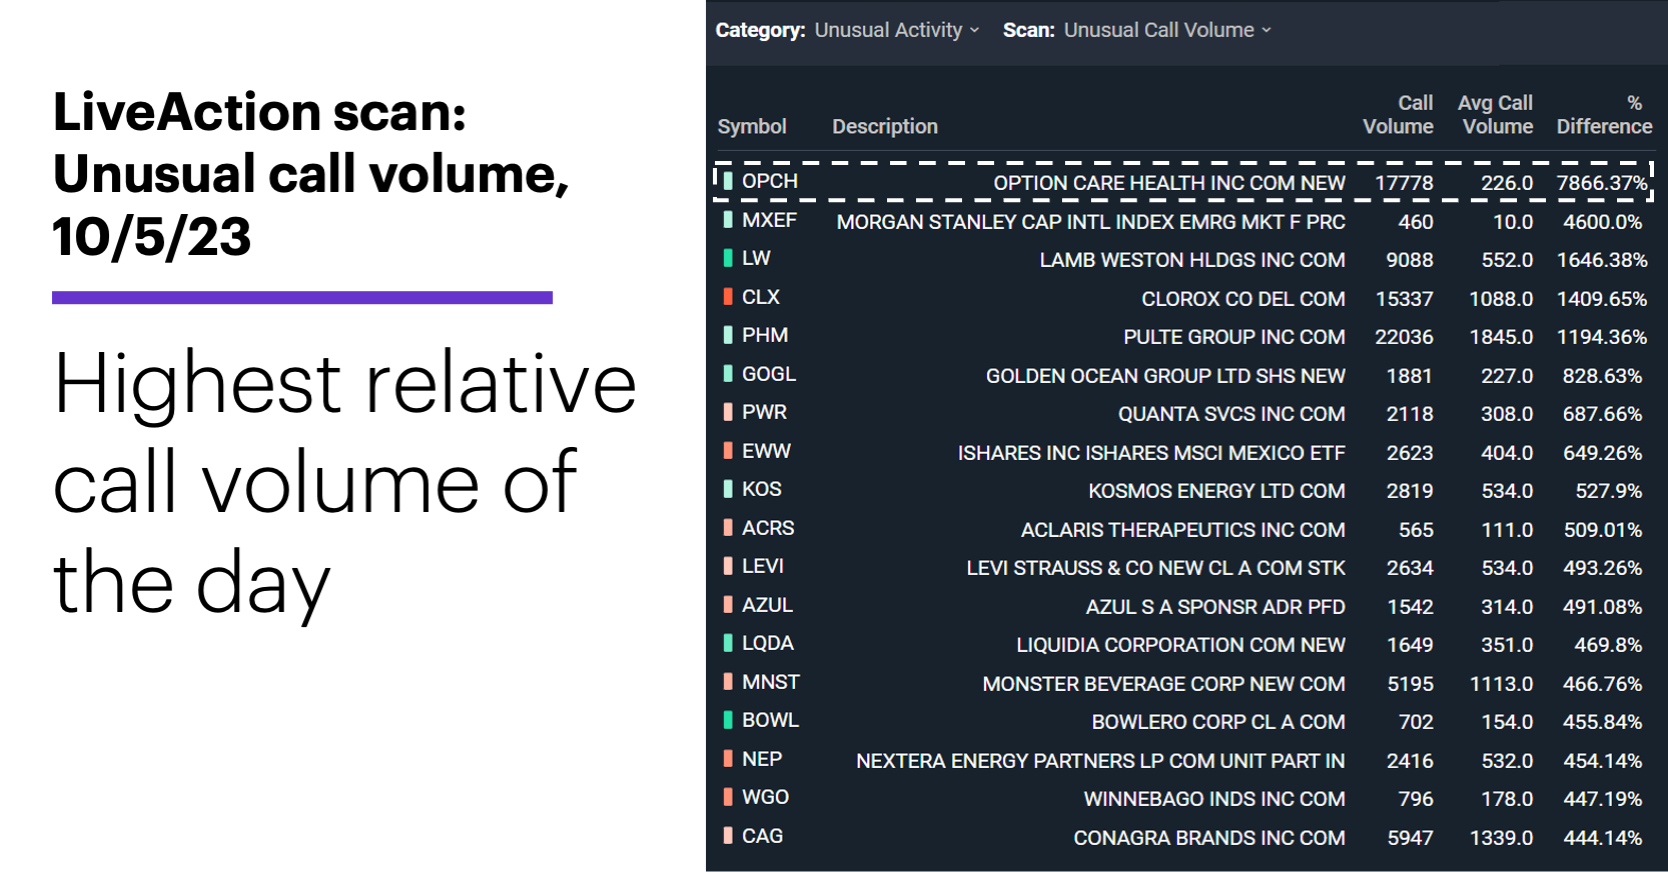
Source: Power E*TRADE. (For illustrative purposes. Not a recommendation.)
The fact that OPCH also spent much of the day in positive territory while the broad market was in the red may have led some traders to bullish conclusions about the day’s activity, but there were a few other pieces of information to consider. Most importantly, 17,700 contracts traded in the October $35 calls, which were out of the money by approximately $2.50 at midday. But the open interest (OI) was more than 22,000.
So, were traders getting into these calls or getting out of them? The following price chart shows OPCH has been pulling back fairly steadily since hitting a 10-month high in August:
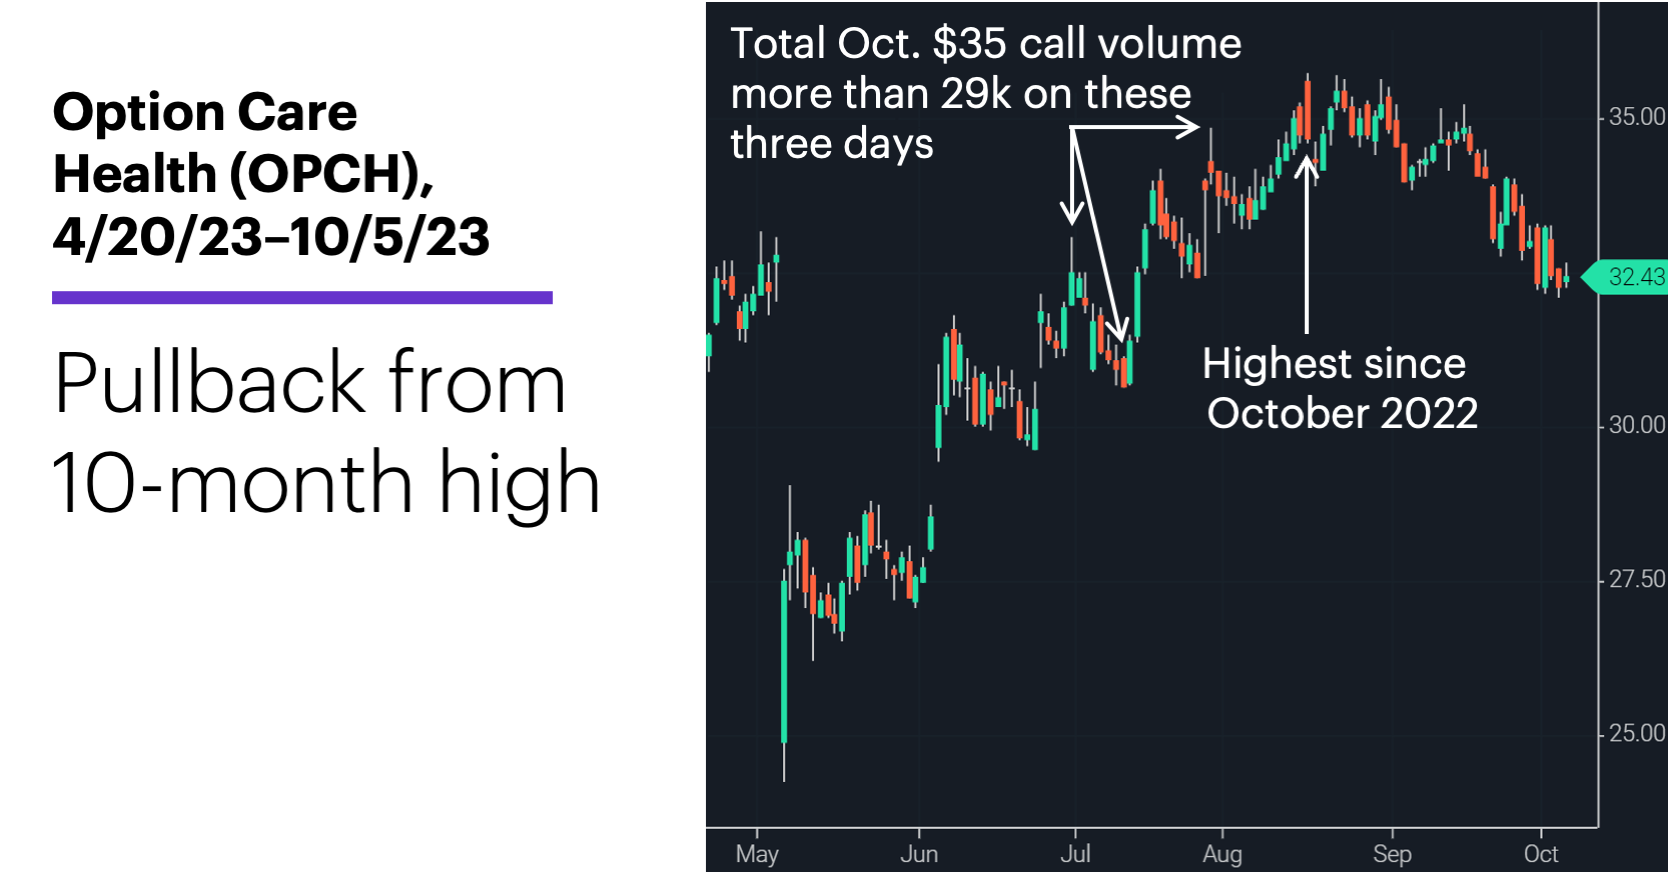
Source: Power E*TRADE. (For illustrative purposes. Not a recommendation.)
The chart also shows a trader (or traders) put up big numbers in the October $35 calls on three days—June 30, July 12, and July 18. And although OPCH continued to rally into mid-August, as of yesterday it had pulled back to where it was at the end of June. (Brief, real-world illustration of time decay: On July 12, OPCH closed at $30.66. On Thursday it was trading more than 5% higher, but the October $35 call had lost more than 80% of its value, falling from $0.90 to $0.15.)
If today’s OI in the $35 calls is higher than it was yesterday, traders who initially interpreted Thursday’s activity as potentially bullish may be able to justify that outlook, at least in the absence of evidence to the contrary. If today’s OI is lower, it will be more difficult to make that argument.
Market Mover Update: After its biggest down day in more than a year, November WTI crude oil futures (CLX3) followed through to the downside on Thursday, trading as low as $82.15 intraday and testing support at the August highs:
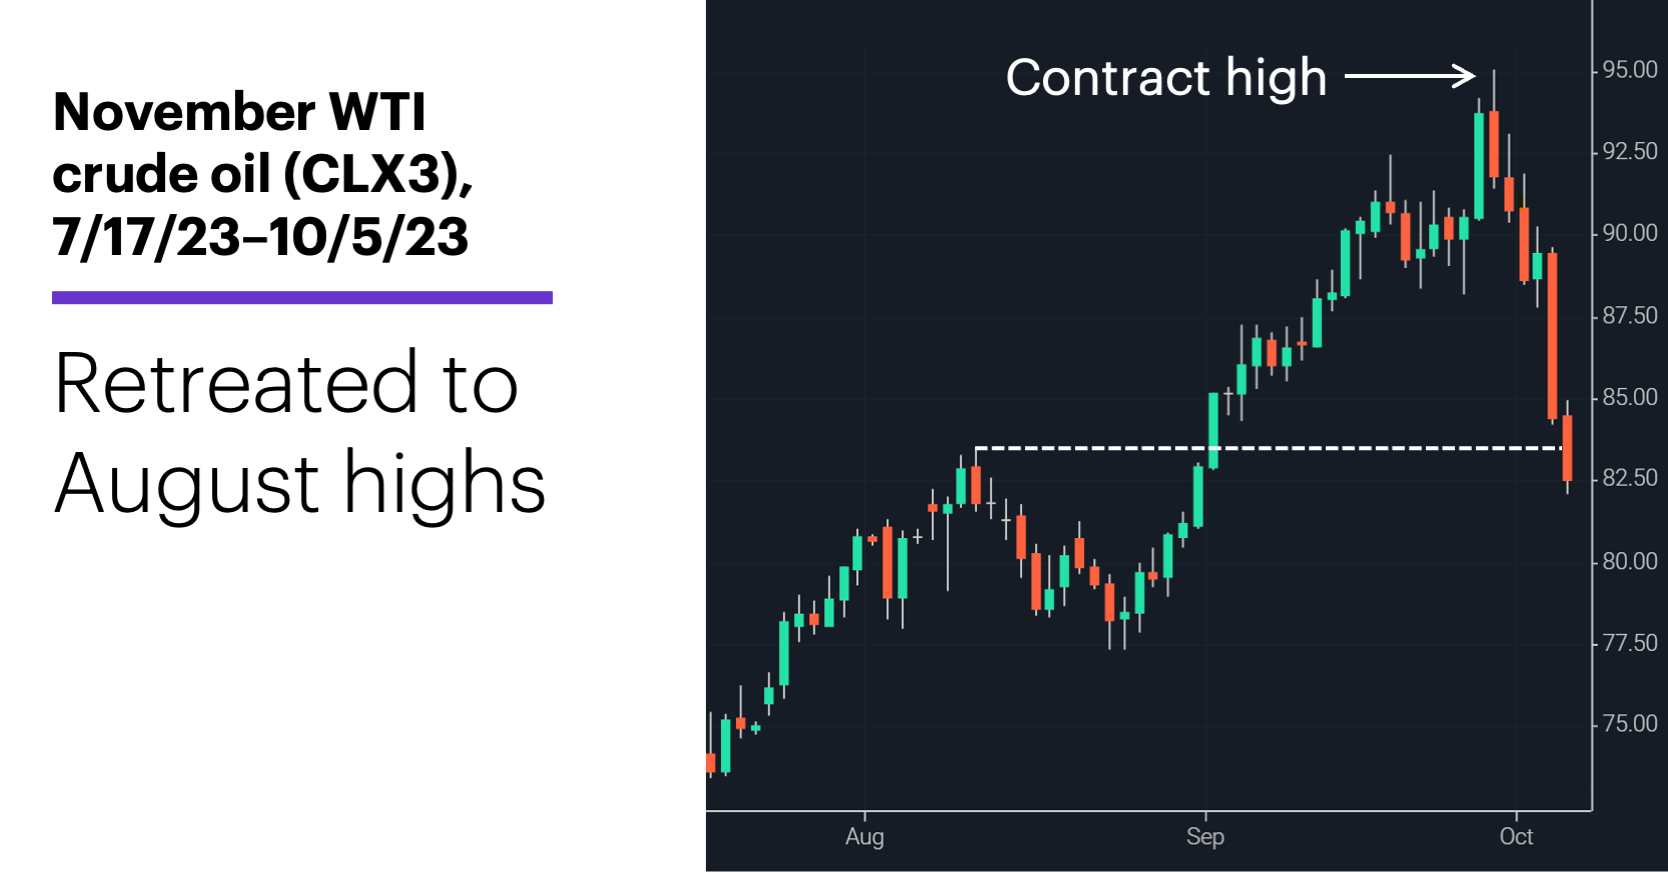
Source: Power E*TRADE. (For illustrative purposes. Not a recommendation.)
Yesterday’s move dropped the market roughly 13% below the contract high of $95.03 it hit six trading days ago.
Constellation Brands (STZ) sold off Thursday after releasing earnings. The stock is down more than 6% since breaking the downside of its trading range on September 25 (see “Volatility jumps despite trading range”).
Some traders will be paying close attention to whether the S&P 500 (SPX) closes higher or lower this week. The market’s shorter-term performance (one to two months) has, historically, been very different after the SPX closes lower five weeks in a row vs. when it snaps a four-week losing streak. Check back on Monday for details.
Today’s numbers include (all times ET): Employment Report (8:30 a.m.)
Click here to log on to your account or learn more about E*TRADE's trading platforms, or follow the Company on Twitter, @ETRADE, for useful trading and investing insights.