Next stop: Inflation
- Stocks fall, yields rise amid debt downgrade, mixed jobs data
- Saudi decision fuels oil jump, tech swings to lower low
- This week: Consumer Price Index (CPI) and Producer Price Index (PPI)
Stocks suffered their first down week in a month—and only the third in the past 12 weeks—as traders digested a surprise downgrade of US debt, more Big Tech earnings, and lukewarm employment numbers.
The S&P 500 (SPX) fell 1.3% last Wednesday, and ended the week by surrendering a solid intraday rally after the release of Friday’s monthly jobs report. It was the SPX’s biggest weekly loss since March:
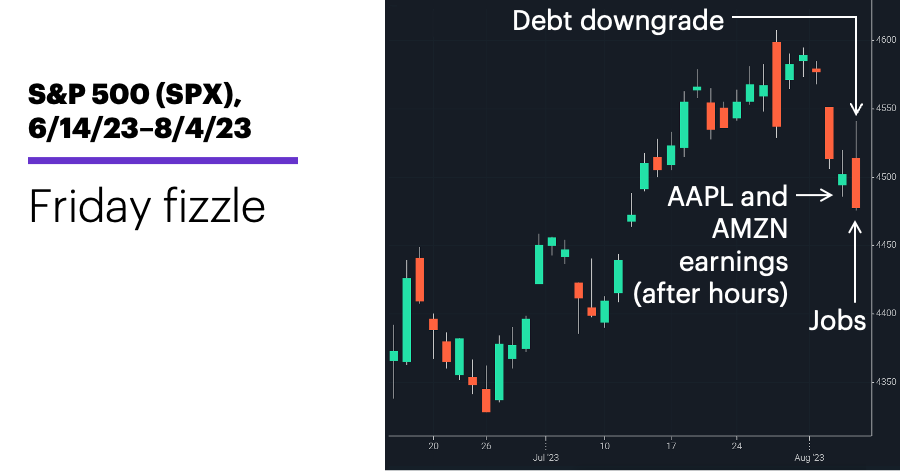
Source: Power E*TRADE. (For illustrative purposes. Not a recommendation. Note: It is not possible to invest in an index.)
The headline: Debt downgrade rattles stocks.
The fine print: The downgrade of US debt (from AAA to AA+) by one ratings agency was widely cited as a trigger for Wednesday’s sell-off. But Morgan Stanley analysts downplayed its importance, suggesting investors should be more focused on other issues, including the trajectory of inflation.1
The number: 4.4%, the higher-than-expected increase in hourly earnings revealed in Friday’s jobs report. While payrolls were below estimates, the report as a whole came up a little short of establishing the clear trend of loosening of labor conditions the Fed has said it wants to see before backing off on interest rates.
The move: The 10-year T-note yield hit 4.19% last Thursday—it’s highest level since November 8, 2022—before pulling back sharply on Friday.
The scorecard: The Nasdaq 100 (NDX) tech index lost the most ground last Wednesday, and for the week as a whole:
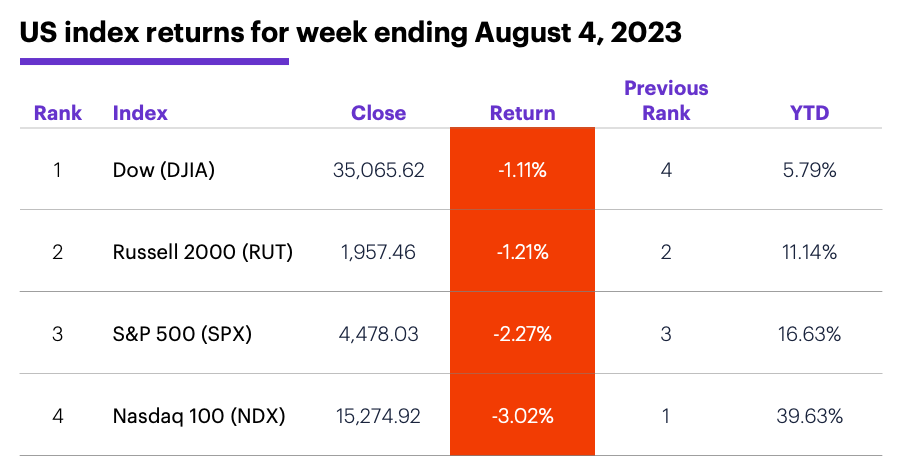
Source (data): Power E*TRADE. (For illustrative purposes. Not a recommendation.)
Sector returns: The strongest S&P 500 sectors last week were energy (+1.2%), consumer discretionary (-0.3%), and financials (-0.9%). The weakest sectors were utilities (-4.7%), information technology (-4.2%), and communication services (-2.9%).
Stock movers: Telephone & Data Systems (TDS) +88% to $14.84, and United States Cellular (USM) +93% to $33.76, both on Friday. (TDS owns 83% of USM, and on Friday TDS announced it was pursuing “strategic alternatives” for the cellular provider.2) On the downside, TG Therapeutics (TGTX) -49% to $10.49 on Tuesday, Driven Brands (DRVN) -41% to $15.2 on Wednesday.
Futures: After falling 2% to $79.75 last Wednesday, September WTI crude oil (CLU3) jumped 2.8% on Thursday as Saudi Arabia announced it would extend its output reduction to September. The market ended the week at $82.82, near the high of its long-term consolidation. December gold (GCZ3) tagged a one-month intraday low of $1,954.50 on Friday, but rebounded to close at $1,976.10. Week’s biggest gainers: August VIX (VXQ3) +17.1%, August whey (DYQ3) +4.9%. Week’s biggest losers: September wheat (ZWU3) -10.1%, September hard red wheat (ZKEU3) -12.1%.
Coming this week
Inflation takes center stage on the economic calendar this week:
●Monday: Consumer Credit
●Tuesday: NFIB Small Business Optimism Index, Trade Balance, Wholesale Inventories
●Thursday: Consumer Price Index (CPI)
●Friday: Producer Price Index (PPI), Consumer Sentiment (prelim)
This week’s earnings include:
•Monday: BioNTech (BNTX), Tyson Foods (TSN), Palantir (PLTR), RingCentraL (RNG), Teradata (TDC)
•Tuesday: Datadog (DDOG), Eli Lilly (LLY), Plug Power (PLUG), United Parcel Service (UPS), Crispr Therapeutics (CRSP), iRobot (IRBT), Lyft (LYFT), Upstart (UPST), Wynn Resorts (WYNN)
•Wednesday: Roblox (RBLX), AppLovin (APP), Maxeon Solar Technologies (MAXN), The Trade Desk (TTD), Viasat (VSAT)
•Thursday: Dillard’s (DDS), Nio (NIO), Ralph Lauren (RL), Yeti (YETI), BRC (BRCC), Dice Therapeutics (DICE)
•Friday: Spectrum Brands (SPB)
Check the Active Trader Commentary each morning for an updated list of earnings announcements, IPOs, economic reports, and other market events.
Tech index pullback
The NDX was the biggest mover last week among US indexes, and “Nasdaq highs and lows” highlighted the fact that the tech index swung to a lower low and lower high for the first time since April.
Last Wednesday’s 2.2% loss was also the NDX’s biggest down day since February. The index then closed lower on both Thursday and Friday. After that pattern—a 2%-or-larger daily loss followed by two more lower closes—the NDX was, on average, more bullish in the near term than it was when the big down day was followed by a down close and an up close. 3 In the former case (last week’s pattern), the NDX’s average five-day return was +1.6%, while in the latter case, it was -0.3%.
Click here to log on to your account or learn more about E*TRADE's trading platforms, or follow the Company on Twitter, @ETRADE, for useful trading and investing insights.
1 MorganStanley.com. How Will the U.S. Credit Downgrade Affect Markets? 8/2/23.
2 FierceWireless.com. TDS explores 'strategic alternatives' for UScellular. 8/4/23.
3 All figures reflect Nasdaq 100 (NDX) daily closing prices, 1985–August 2023. Supporting document available upon request.