A summer swoon
- Market slump reaches three weeks, bonds also retreat
- Small caps and tech lead pullback, oil cools
- This week: Jackson Hole, durable goods, more retail earnings
On July 31, the S&P 500 (SPX) logged its highest close since March 30, wrapping up a robust (+9.8%) two-month rally. As of last week, the SPX had given back more than half that gain, falling to its lowest levels since late June.
Despite another collection of strong US economic data, the SPX fell for a third-straight week for the first time this year, and only the second time since last September. But the index also erased a good-sized intraday loss on Friday to end the day flat:
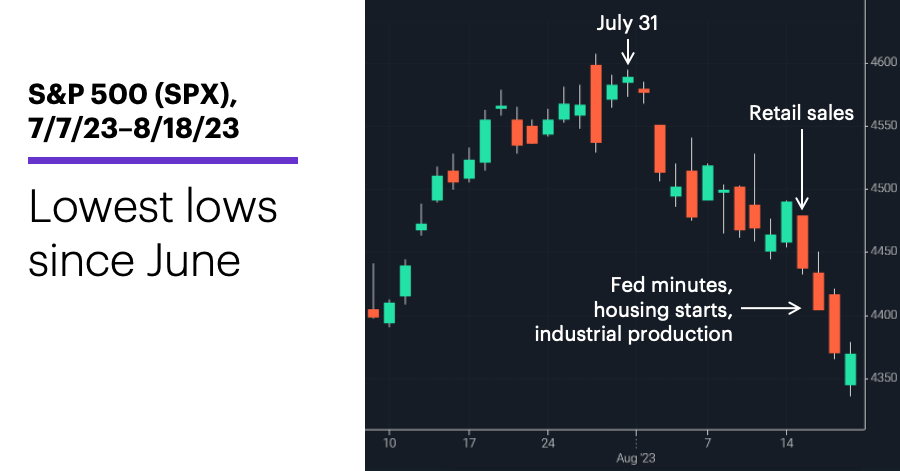
Source: Power E*TRADE. (For illustrative purposes. Not a recommendation. Note: It is not possible to invest in an index.)
The headline: Economy solid, market soft.
The fine print: The monthly retail sales report was stronger than expected, housing starts were strong, industrial production topped estimates, and weekly jobless claims were modest—all highlighting the US economy’s ongoing strength. But investors may have chosen to focus on how this may contribute to higher-for-longer interest rates (as hinted at in last Wednesday’s FOMC minutes), while warnings of another potential downgrade of US banks and weak economic data out of China contributed to the sour mood.
The move: The 10-year T-note yield closed at 4.29% on Thursday—its highest close since 2007.
The scorecard: Like the week before, the small-cap Russell 2000 (RUT) and the Nasdaq 100 (NDX) tech index lost the most ground last week:
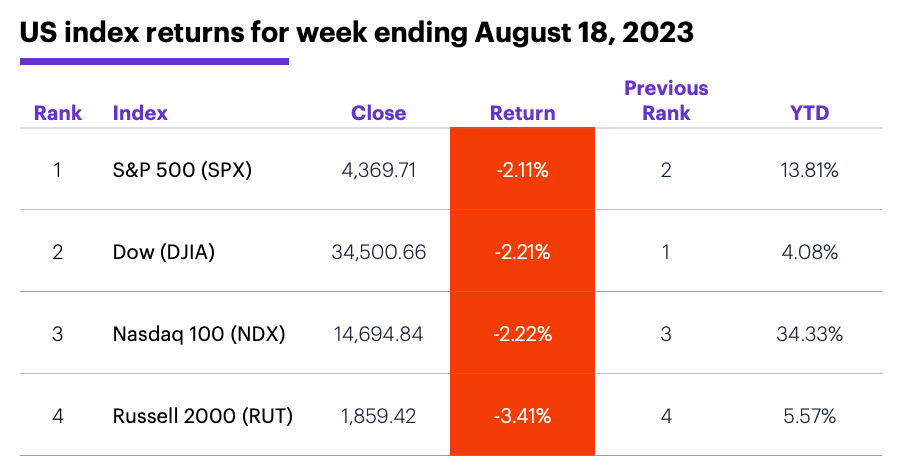
Source (data): Power E*TRADE. (For illustrative purposes. Not a recommendation.)
Sector returns: The strongest S&P 500 sectors last week were information technology (-0.9%), health care (-1.6%), and energy (-1.7%). The weakest sectors were consumer discretionary (-4.1%), real estate (-3.3%), and financials (-2.8%).
Stock movers: United States Steel (X) +37% to $31.08 on Monday, DLocal (DLO) +32% to $20.45 on Wednesday. On the downside, Hawaiian Electric (HE) -34% to $21.46 on Monday (and -31% to $14.79 on Tuesday, and -58% for the week), Coherent (COHR) -30% to $32.97 on Wednesday.
Futures: After selling off sharply last Tuesday–Wednesday, September WTI crude oil (CLU3) rebounded to end the week with a modest loss at $81.25. Although Friday was the first day in two weeks that December gold (GCZ3) didn’t make a lower low or lower close, the market ended the week down more than $30 at $1,916.50. Week’s biggest gains: September VIX (VXU3) +7.7%, November orange juice (OJX3) +7.7%. Week’s biggest losses: August Micro bitcoin (MBTQ3) -11.8%, August Micro ether (ETHQ3) -10.2%.
Coming this week
Traders will be tracking the Jackson Hole economic confab—especially anything Fed chief Jerome Powell says—along with data on durable goods and home sales:
●Tuesday: Existing Home Sales
●Wednesday: S&P Global Manufacturing and Services PMIs (flash), New Home Sales, Jackson Hole Symposium
●Thursday: Durable Goods Orders, Chicago Fed National Activity Index, Jackson Hole Symposium
●Friday: Consumer Sentiment, Jackson Hole Symposium
A healthy number of high-profile tech names are scattered throughout the second week of retail earnings. Here’s a sample:
●Monday: Fabrinet (FN), Zoom (ZM)
●Tuesday: BJ’S Wholesale Club (BJ), Canadian Solar (CSIQ), Dick’s Sporting Goods (DKS), Lowe’s (LOW), Macy’s (M), Medtronic (MDT), Toll Brothers (TOL), Urban Outfitters (URBN)
●Wednesday: Advance Auto Parts (AAP), Analog Devices (ADI), Dycom (DY), Foot Locker (FL), Kohl’s (KSS), Peloton (PTON), Williams Sonoma (WSM), Autodesk (ADSK), Nvidia (NVDA), Snowflake (SNOW), Splunk (SPLK)
●Thursday: Burlington Stores (BURL), Dollar Tree (DLTR), Intuit (INTU), Nordstrom (JWN), Marvell Technology (MRVL), Ulta Beauty (ULTA), Workday (WDAY)
●Friday: Hibbett (HIBB), Ubiquiti (UI)
Check the Active Trader Commentary each morning for an updated list of earnings announcements, IPOs, economic reports, and other market events.
50-day MA chatter
The SPX closed below its 50-day moving average (MA) last Tuesday for the first time since March. More than one market commentator noted the potentially bearish implications of this development.
The market could very well continue to pull back—for any number of reasons. If it does, though, last week’s close below the 50-day MA may be better thought of as a symptom rather than a trigger. The following table compares the SPX’s average returns for all 5-day, 10-day, 20-day, and 60-day periods since 1960 to those after the index closed below its 50-day moving average:
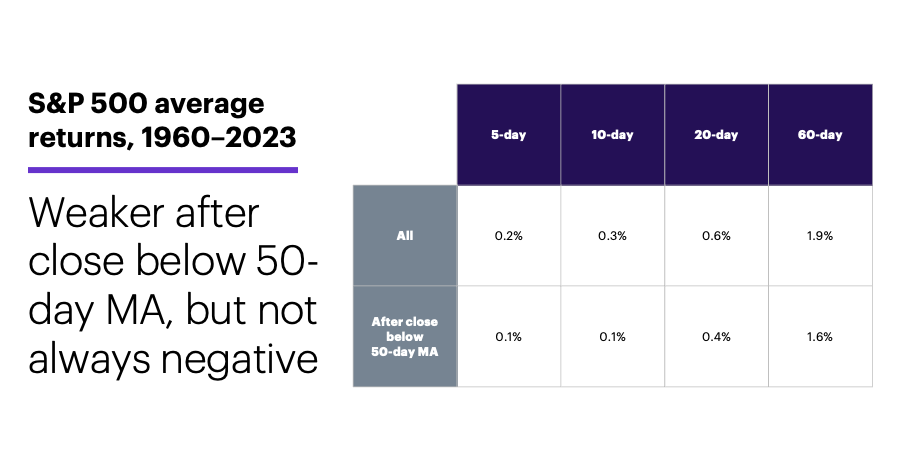
Source (data): Power E*TRADE. (For illustrative purposes. Not a recommendation.)
While the SPX’s returns after falling below the 50-day MA were smaller than its benchmark returns, it’s also true these returns were positive, not negative. In other words, after it closed below its 50-day MA, the SPX was, more often than not, higher five, 10, 20, and 60 trading days later.1
Of course, the concern is always that the latest cross below the 50-day MA will be like the ones in October 2018, February 2020, or January 2022, to name just a few that were followed by significant sell-offs. But history shows those were the exception rather than the rule. Yes, this could turn out to be one of those exceptions, but it’s still more accurate to think of a cross below the 50-day MA as something that occurs during a significant market sell-off, rather than thinking of it as a cause of the sell-off.
Click here to log on to your account or learn more about E*TRADE's trading platforms, or follow the Company on Twitter, @ETRADE, for useful trading and investing insights.
1 All figures reflect SPX (SPX) daily closing prices, 1960–August 2023. Figures refer to days the SPX closed below its 50-day simple moving average one day after closing above it. Supporting document available upon request.