Market pauses amid soft numbers
- Stocks pull back, investors lighten up on small caps and tech
- Economic data weakens, bond prices jump as yields tumble
- This week: CPI and PPI, Fed minutes, retail sales, earnings season
As traders gear up for another busy week of numbers—and the start of earnings season—the stock market will attempt to bounce back from its first down week since March 10.
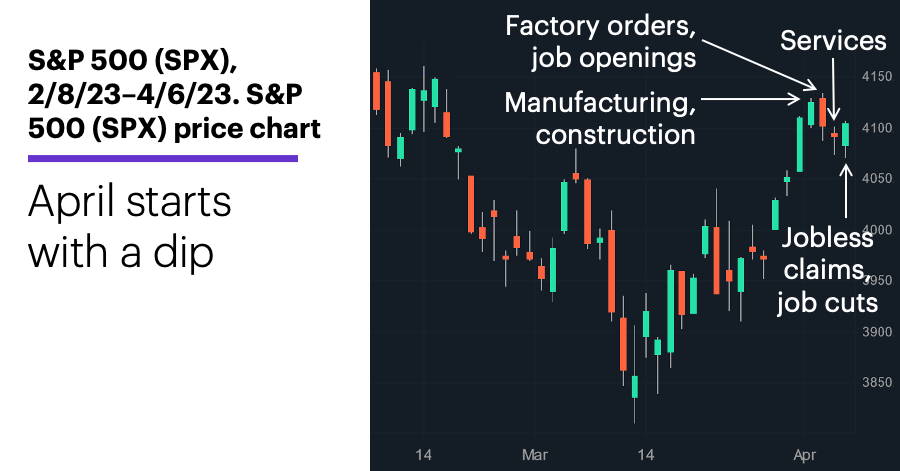
It wasn’t much of a pullback, but the S&P 500’s (SPX) three-week win streak came to an end amid a steady stream of softer-than-expected economic data:
Source: Power E*TRADE. (For illustrative purposes. Not a recommendation.) Note: It is not possible to directly invest in an index.
The headline: Stocks down, bonds up, economy cool.
The fine print: Almost all of last week’s economic data points—manufacturing, services, construction spending, factory orders, jobs cuts, weekly jobless claims—came in below estimates. There are two sides to this coin: The positive side is that it suggests the Fed’s rate-hiking campaign is cooling inflation, the negative side is that it could signal the economy is tilting toward recession.
The number: 236,000, the number of new jobs created in March—slightly below estimates (and down from February), but still resilient. In short, labor numbers are pointing in the direction the Fed wants them to go, but they may not have dropped off enough for the Fed to stop raising interest rates. As of Friday, the odds of a 0.25% rate hike in May stood at 71%.1
The move: The yield on the benchmark 10-year T-note ended last week at a seven-month low of 3.29%.
The scorecard: The Dow eked out a small gain, but the Russell 2000 (RUT) small cap index and the Nasdaq 100 (NDX) tech index fell the most, as investors turned away from the economically sensitive growth and tech stocks that led the market during its most recent bounce:
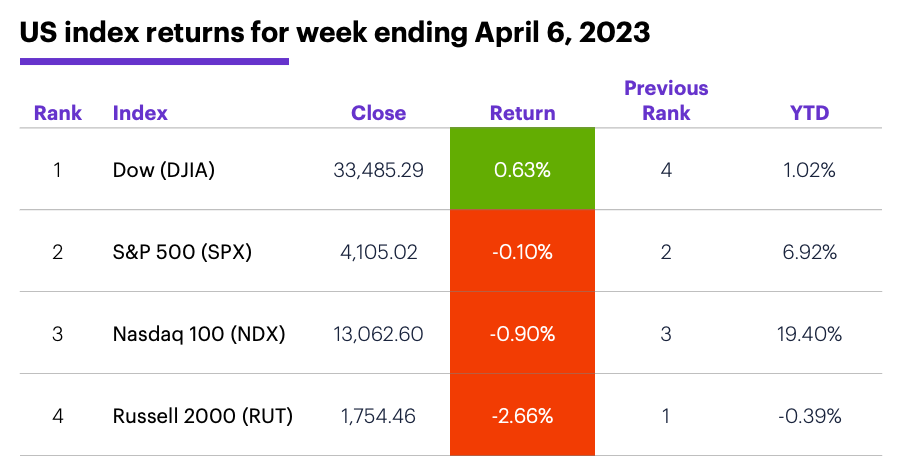
Source (data): Power E*TRADE. (For illustrative purposes. Not a recommendation.)
Sector returns: The strongest S&P 500 sectors last week were utilities (+3.11%), health care (+3.08%), and energy (+3%). The weakest sectors were industrials (-3.4%), consumer discretionary (-3%), and materials (-1.3%).
Stock movers: Heska (HSKA) +21% to $117.74 on Monday, Scilex (SCLX) +57% to $12.4 on Wednesday. Ascendis Pharma (ASND) -32% to $72.83 on Monday, C3 Ai (AI) -26% to $24.95 on Tuesday.
Futures: After last Monday’s 6.3% surge to $80.42/barrel, May WTI crude oil (CLK3) traded sideways, closing Thursday at $80.70. June gold (GCM3) tagged its highest level in more than a year last Wednesday ($2049.20) before ending the week at $2,026.40/ounce.
Coming this week
Traders will get plenty of inflation data to chew on this week, along with minutes from the March Fed policy meeting:
●Monday: Wholesale Inventories, New York Fed Consumer Inflation Expectations
●Tuesday: NFIB Business Optimism Index
●Wednesday: Consumer Price Index (CPI), FOMC minutes
●Thursday: Producer Price Index (PPI)
●Friday: Retail Sales, Import and Export Prices, Industrial Production, Capacity Utilization, Consumer Sentiment (preliminary), Business Inventories
Bank earnings signal the beginning of Q1 reporting season:
●Monday: Greenbrier (GBX), PriceSmart (PSMT)
●Tuesday: Albertson’s (ACI), CarMax (KMX)
●Wednesday: Apogee Enterprises (APOG)
●Thursday: Delta Air Lines (DAL), Fastenal (FAST), First Republic Bank San Francisco (FRC), Infosys (INFY), Progressive (PGR)
●Friday: Blackrock (BLK), Citigroup (C), JPMorgan Chase (JPM), PNC Financial Services PNC), UnitedHealth (UNH), Wells Fargo (WFC)
Check the Active Trader Commentary each morning for an updated list of earnings announcements, IPOs, economic reports, and other market events.
X marks the spot
The market, as they say, is forward looking, and we’re now a little less than two months from something few investors have been looking forward to—the early-June deadline to formally raise the debt ceiling. In short, if Congress doesn’t authorize the government to borrow more money to pay its bills, the US could default on its debt for the first time. Many Republicans say they want to tie any debt-ceiling increase to spending cuts. Democrats say that’s a non-starter.
Although we’ve been here before—Congress has adjusted the debt ceiling 78 times since 1960—one need only look at any stock index chart from July–October 2011 to get an idea of the type of trouble a debt-ceiling battle can trigger. While default was avoided at the last minute, some financial rating agencies downgraded US debt and the SPX fell around 17% in less than three weeks.
An argument could be made that, having weathered a few debt-ceiling fights since then, the markets are better prepared for this year’s stare-down. But Morgan Stanley Research has pointed out that some lawmakers may believe the Fed and the Treasury, in the event of an emergency, would step in to avoid a default—a perceived safety net that could incentivize Congress to dig in their heels on the issue for an “uncomfortably long amount of time.”2
Their suggestion? Watch T-bills, since the shortest-term Treasuries would come under above-average selling pressures as investors try to avoid maturities closest to the debt-ceiling “X-date.”
Click here to log on to your account or learn more about E*TRADE's trading platforms, or follow the Company on Twitter, @ETRADE, for useful trading and investing insights.
1 CME FedWatch Tool (cmegroup.com). 4/7/23.
2 MorganStanley.com. What the ‘X-Date’ Means for Investors. 4/5/23.